
Stagflation Real Estate: How 2026 Markets Are Shifting
title: “Stagflation and Real Estate: How Rising Prices and Falling Jobs Are Reshaping Property Markets in 2026” description: “An evidence-driven analysis of how stagflationary conditionspersistent inflation at 3.1%, unexpected job losses, and a frozen Federal Reserveare creating divergent outcomes across residential and commercial real estate sectors.” primary_keyword: “stagflation-real-estate”
The Load-Bearing Wall Has Cracked
For much of the period between 2023 and early 2026, the prevailing narrative in markets was “higher for longer.” Interest rates remained elevated, but the labor market held firm enough to keep consumer spending intact and prevent the economy from tipping into outright contraction. That resilience was the load-bearing wall of the entire macro outlook. The data released in early 2026 suggests that wall has crackedand the consequences for stagflation-real-estate dynamics are now impossible to ignore.
The clearest break came in February 2026, when non-farm payrolls showed the U.S. economy unexpectedly losing 92,000 jobs against a consensus expectation of a 55,000 gain, according to TreasurySpring. The unemployment rate edged up to 4.4 percent. That miss alone would have been significant. But it arrived alongside, rather than instead of, rising inflation: core PCE climbed for a second consecutive month in January 2026, reaching 3.1 percentwell above the Federal Reserve’s 2 percent target and moving in the wrong direction.
When employment weakens at the same time that a key inflation gauge is re-accelerating, the combination fits the textbook definition of stagflationsimultaneous economic stagnation and persistent price pressurerather than a conventional slowdown in which cooling demand eventually pulls inflation lower. For real estate markets, where valuations, transaction volumes, and credit availability are all acutely sensitive to both sides of that equation, this represents a structural inflection point rather than a cyclical pause.
What makes this moment especially difficult is the Fed’s effective paralysis. The Federal Open Market Committee held rates steady at its March 2026 meeting. Cutting rates to support a weakening labor market risks further entrenching inflation that has not yet absorbed the full impact of tariffs or the energy price pressures stemming from the conflict in Iran. Raising rates to combat inflation would accelerate job losses in an economy already contracting. As TreasurySpring noted, “we still haven’t seen the full effect of tariffs feeding through, meaning inflation may have remained well above the 2% target for some time, even without the effects of the war in Iran on energy prices.”
For investors, the shift from “higher for longer” to potential stagflation changes the calculus in material ways. In a simple rate-driven slowdown, rate-sensitive sectors stand to benefit once the Fed pivots to cuts. In a stagflationary environment, that pivot may be delayed, partial, or absent altogether. Real estate investors who underwrote deals assuming that rate relief would arrive once the economy softened now face a scenario in which both legs of the thesisfalling rates and stable demandare in question simultaneously.
What follows is an attempt to map how these conditions translate into sector-level outcomes, grounding each assessment in the data as it stands rather than in assumptions about a policy rescue that may not arrive.
The Numbers That Changed the Narrative
Three data releases in early 2026 stood out for their magnitude, surprise factor, and policy implications, collectively shaping the macroeconomic landscape ahead of the March FOMC meeting.
February’s non-farm payrolls print showed the U.S. economy unexpectedly losing 92,000 jobs versus an expected gain of 55,000a miss of approximately 147,000 jobs relative to consensus, according to TreasurySpring. The unemployment rate rose slightly to 4.4 percent. Meanwhile, core PCE rose for a second consecutive month in January 2026, reaching 3.1 percent.
The table below places these readings in context:
| Indicator | Feb 2026 Reading | Approx. 6 Months Prior | Fed Target |
|---|---|---|---|
| Non-farm payrolls (monthly change) | 92,000 | Positive gains (exact figure unavailable) | Sustained job growth |
| Unemployment rate | 4.4% | ~4.14.2% (approximate) | ~4.0% benchmark |
| Core PCE (year-over-year) | 3.1% (Jan 2026) | ~2.62.8% (approximate) | 2.0% |
The six-months-prior estimates are approximate, as the available evidence does not provide exact August 2025 readings. The directional trend, however, is unambiguous: all three metrics moved meaningfully in an unfavorable direction.
The February payrolls number deserves particular scrutiny for its surprise component. The swing of roughly 147,000 jobs from expectations made it one of the larger downside misses in recent memory. As TreasurySpring reported, the economy was described as “unexpectedly losing” jobs, underscoring that the deterioration was not widely anticipated. The shift from expected modest growth to outright contraction in payrolls marked a qualitative change in the labor market narrative, not merely a quantitative miss.
On the inflation side, the core PCE reading carried significance not just for its level but for its trajectory. TreasurySpring noted that tariff effects had not yet fully fed through to inflation as of March 2026, suggesting that the 3.1 percent reading may have understated the true inflationary pressure building in the pipeline. The conflict in Iran was cited as an additional upside risk through energy prices, though the size and duration of that impact remained unknown.
It is essential to distinguish what these data points confirm from what they leave unresolved. The headline figures establish the direction and magnitude of labor market deterioration and inflation persistence. However, the available evidence does not provide a sectoral breakdown of the 92,000 jobs lost, leaving open whether losses were concentrated in trade-sensitive industries, government, or services. The core PCE figure is a national aggregate and does not reveal whether inflation pressures were driven primarily by housing, goods, or services components.
Market inferences about the Fed’s likely responsetraders pricing in slightly over two rate cuts for the remainder of 2026 while FOMC members signaled only one, per TreasurySpringare forward-looking expectations rather than verified policy commitments.
J.P. Morgan Asset Management published an FOMC Statement commentary for March 2026, which could have provided additional institutional analysis. However, the substantive content was not accessible due to institutional investor gating. The analysis here relies primarily on the TreasurySpring summary, which remains the most detailed publicly available account of these data releases and their implications.
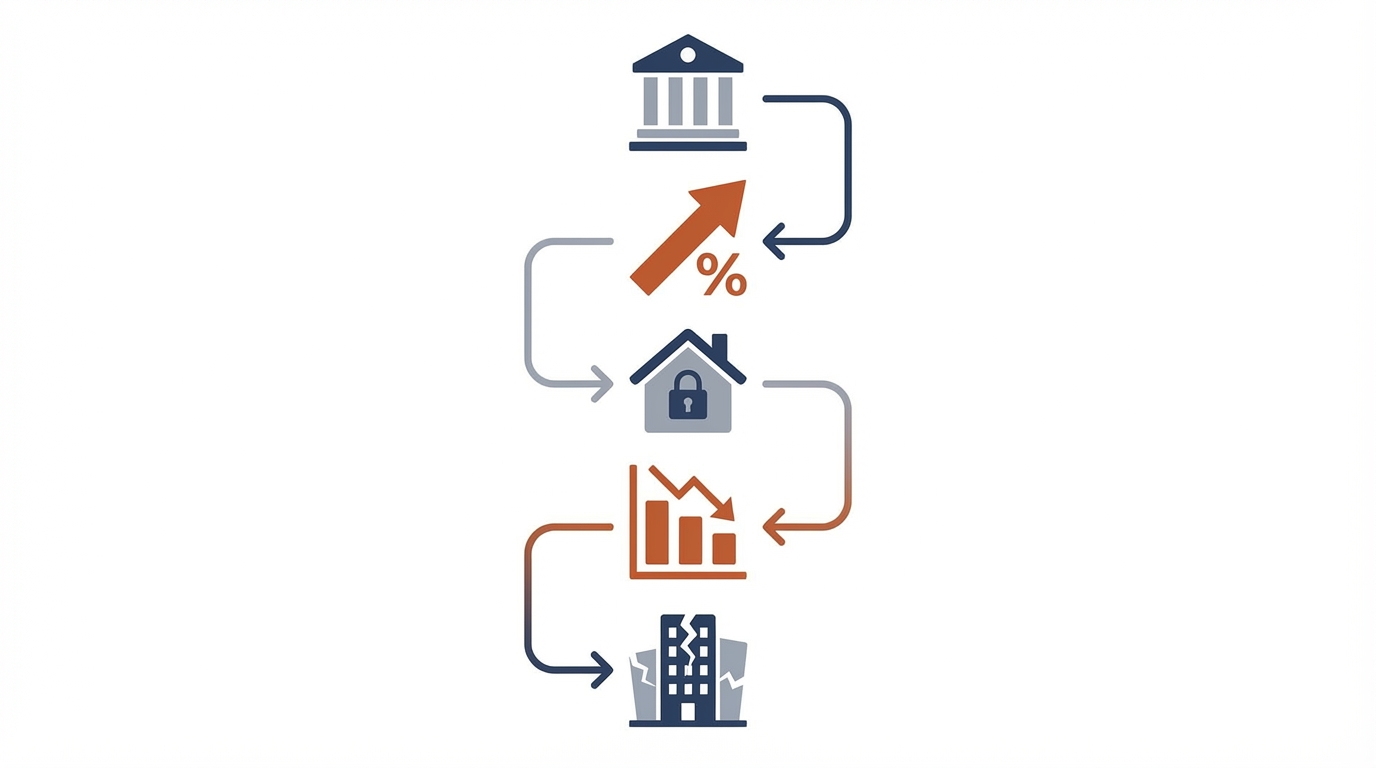
From Fed Paralysis to Property Distress: The Transmission Chain

The U.S. economy unexpectedly lost 92,000 jobs in February 2026, a swing of nearly 147,000 jobs versus the consensus expectation of a 55,000 gain.
The transmission chain linking stagflationary conditions to real estate distress operates through a series of reinforcing links, each documented by emerging data from early 2026.
Link 1: The Fed holds. With core PCE at 3.1 percent and rising, the FOMC held rates steady in March 2026. Unresolved inflationary pressures from tariffs and the Iran conflict constrain any near-term easing. Traders priced in slightly over two cuts for the year; the Fed signaled one at most, or possibly none.
Link 2: Mortgage rates stay elevated. When the federal funds rate remains high and inflation expectations stay unanchored, the 10-year Treasury yieldthe benchmark for mortgage pricinghas little room to decline. Thirty-year fixed mortgage rates have remained above 6.5 percent through early 2026.
The affordability gap this creates is stark:
| Scenario | Rate | Monthly P&I (30-yr, $400K loan) | Increase vs. 2021 |
|---|---|---|---|
| 2021 (approx.) | 2.95% | ~$1,681 | |
| Early 2026 (approx.) | 6.75% | ~$2,594 | +$913 (+54%) |
Link 3: Household income erodes. February’s payroll loss of 92,000 jobs and rising unemployment to 4.4 percent mean fewer households can qualify for or justify a purchase when monthly mortgage payments are more than 50 percent higher than four years ago.
Link 4: Transaction volumes compress. While precise volume data for early 2026 was not available in the reviewed sources, the combination of elevated rates and weakening employment strongly suggests continued downward pressure on residential closingsconsistent with the affordability-driven slowdown observed in prior rate cycles.
Link 5: Tenant credit deteriorates. As unemployment rises and payrolls contract, businesses face declining revenues and may reduce headcount further, weakening their ability to meet lease obligations. This is particularly acute in office markets already challenged by remote work and in sectors sensitive to consumer spending.
Link 6: Construction slows. When financing costs remain elevated, new construction starts decelerate because projected rents in many markets cannot justify the cost of capital.
Link 7: The refinancing wall arrives. A wave of commercial real estate loans originated during the low-rate era of 20202022 is approaching maturity. Borrowers who locked in rates well below current levels now face refinancing at substantially higher costs, compressing or eliminating net operating income margins. Properties viable at 34 percent debt costs may not pencil at 6.5 percent or above.
Conceptually, the chain flows as follows: above-target inflation leads the Fed to hold rates, which keeps mortgage rates elevated, which widens the affordability gap as employment weakens, which depresses residential transaction volumes, which erodes tenant credit in commercial markets, which slows construction, which spikes refinancing risk for maturing commercial loans. Each link reinforces the others. The critical uncertainty, as TreasurySpring highlighted, is whether the FOMC will ultimately cut rates once, twice, or not at all in 2026.
Sector Scorecard: Where the Pain Concentrates
The macroeconomic boundary conditionssticky-high inflation, a labor market in contraction, a frozen Fed, and geopolitical tail riskscreate sharply divergent outcomes across real estate sectors.
Office stands out as the most acutely exposed segment. The sector was already contending with secular demand declines from hybrid work adoption. Stagflationary conditions intensify every dimension of risk. Rising unemployment directly reduces tenant demand. Sticky inflation keeps refinancing costs elevated for the wave of office loans maturing in 20252027. The refinancing wall for Class B and C office assets in secondary markets represents the most concentrated pocket of distress in commercial real estate. It should be noted that sector-specific default data for office loans as of early 2026 was not available in the sources reviewed; this assessment is inferential.
Multifamily (Sun Belt speculative) faces a distinct set of pressures. Supply pipelines initiated during 20212022 have been delivering units into markets where job growth is now reversing. Inflation at 3.1 percent and rising energy costs squeeze household budgets, limiting tenants’ ability to absorb rent increases. Luxury and Class A multifamily in oversupplied Sun Belt cities likely faces the sharpest rent concessions.
Single-family residential is caught between inflation-driven construction cost increases and employment-driven demand weakness. The luxury segment is particularly vulnerable to a transaction freeze, while entry-level segments may see more stable demand supported by demographic need, albeit constrained by affordability pressures.
Industrial and logistics occupies a more nuanced position. Tariff-driven supply chain restructuring could sustain demand for warehouse space even as the broader economy weakens. However, speculative industrial development in markets that overbuilt during the e-commerce surge may face softening.
Necessity retailgrocery-anchored centers, pharmacies, essential serviceshistorically demonstrates the strongest defensive characteristics in stagflationary environments. Consumer spending on necessities is relatively inelastic, and lease structures often include inflation escalators.
Affordable and workforce multifamily may exhibit relative resilience, as demand for lower-cost units tends to be countercyclicalthough direct evidence for this dynamic in the current cycle is limited.
The following scorecard synthesizes these dynamics. Scores range from 1 (low vulnerability) to 5 (high vulnerability). These ratings are analytical judgments based on the macro conditions documented by TreasurySpring and established sector characteristics; they are not derived from proprietary models or sector-specific 2026 performance data.
| Sector | Inflation Sensitivity | Employment Sensitivity | Refinancing Risk | Supply Pressure | Overall Distress Risk |
|---|---|---|---|---|---|
| Office (Class B/C) | 4 | 5 | 5 | 3 | Very High |
| Multifamily (Sun Belt Speculative) | 3 | 4 | 4 | 5 | High |
| Single-Family (Luxury) | 3 | 4 | 3 | 2 | ModerateHigh |
| Retail (Discretionary) | 4 | 4 | 3 | 2 | ModerateHigh |
| Single-Family (Affordable/Entry) | 4 | 3 | 2 | 2 | Moderate |
| Industrial/Logistics | 3 | 2 | 3 | 3 | Moderate |
| Retail (Necessity/Grocery-Anchored) | 2 | 2 | 2 | 1 | LowModerate |
| Affordable/Workforce Multifamily | 2 | 2 | 3 | 2 | LowModerate |
The concentration of distress is clearest in office refinancing and speculative Sun Belt multifamily, where structural oversupply collides with cyclical demand destruction and persistently high borrowing costs. Relative resilience clusters around necessity retail, near-shoring-linked industrial, and affordable housing.
The Refinancing Wall: A Second-Order Crisis in Formation

As of March 2026, markets expected roughly two rate cuts for the rest of the year, while FOMC members signaled only onereflecting the Fed’s stagflationary policy bind.
Among the second-order consequences of the stagflationary environment, the looming wave of commercial real estate loan maturities stands out as a potential source of systemic stress.
A substantial volume of CRE debt was originated during 2021 and 2022, when borrowers locked in financing at sub-4 percent interest rates. These loans, typically structured with five-year terms, are now approaching maturity in a radically different rate environment. With the FOMC holding rates steady and core PCE at 3.1 percent, the prospect of meaningful rate relief before these loans come due has diminished considerably.
Stagflation creates a uniquely punishing dynamic for CRE refinancing because it attacks the problem from both sides simultaneously. Persistent inflation constrains the Fed’s ability to lower rates. At the same time, the labor market deterioration evidenced by February’s payroll loss directly undermines the tenant demand and occupancy rates that support property valuations. Borrowers seeking to refinance face not only dramatically higher debt service costs but also declining net operating incomea combination that can push loan-to-value ratios above lender thresholds and trigger covenant violations or forced sales.
The entities most exposed include regional and community banks with disproportionate CRE lending concentrations, holders of lower-rated CMBS tranches, and overleveraged private equity sponsors who acquired properties at peak valuations using floating-rate bridge loans. The exit assumptions embedded in their original underwritinga return to low rates and continued rent growthhave not materialized.
The political uncertainty surrounding Fed leadership adds another layer of unpredictability. TreasurySpring reported that Chair Powell pledged to remain until a Department of Justice investigation concludes or is dismissed, while Senator Thom Tillis was attempting to block Kevin Warsh’s nomination. Warsh’s voting history was described as hawkish, though he had recently adopted a more dovish posture aligned with the President’s preference for rate cuts. The outcome of that leadership contest could meaningfully influence the rate path at a moment when the stakes of each decision have risen sharply.
It is important to note that precise data on the size and timing of the CRE maturity wallincluding the exact volume of loans maturing in 2026 and 2027is not contained in the evidence reviewed for this analysis. What the available macroeconomic evidence does confirm is that the conditions necessary to defuse this risklower rates, stronger employment, and robust tenant demandare moving in the wrong direction simultaneously.
Three Scenarios Through Late 2026
Generated supporting visual
The genuinely ambiguous macro picture as of March 2026 defies clean forecasting. Three scenarios frame the range of plausible outcomes.
Base case (estimated probability: approximately 50 percent). The Fed holds rates steady through at least Q3 2026, delivering at most one 25-basis-point cut late in the year. Core PCE remains in the 2.73.2 percent range. Mortgage rates hover between 6.5 and 7.0 percent. Nominal home values drift roughly sideways nationally, with real values eroding modestly. Distress concentrates in office properties and speculative multifamily. Unemployment drifts toward 4.54.7 percent.
Upside case (estimated probability: approximately 20 percent). Inflation decelerates faster than expectedperhaps because tariff effects prove more transitory or the Iran conflict de-escalates. Core PCE falls below 2.8 percent by mid-year. The Fed signals cuts more aggressively, mortgage rates dip below 6 percent by late 2026, and pent-up demand releases. This scenario requires several favorable developments to coincide and should be treated as optimistic given the current trajectory.
Downside case (estimated probability: approximately 30 percent). Job losses accelerate beyond the February shock, with unemployment rising above 5 percent. Core PCE remains above 3 percent, trapping the Fed. Credit tightening intensifies among regional banks, triggering forced sales of distressed CRE assets. Residential markets see price declines of 510 percent in overbuilt metros. The probability weighting reflects the severity of the February payroll miss and the multiple unresolved inflationary pressures.
| Variable | Base Case | Upside Case | Downside Case |
|---|---|---|---|
| Fed funds rate (year-end 2026) | 5.00%5.25% | 4.25%4.75% | 5.25%5.50% |
| 30-year mortgage rate | 6.5%7.0% | 5.5%6.0% | 7.0%7.5% |
| Unemployment rate | 4.5%4.7% | 4.0%4.3% | 5.0%5.5% |
| Core PCE (year-end 2026) | 2.7%3.2% | 2.3%2.7% | 3.2%3.8% |
| Transaction volume (vs. 2019) | 25% to 35% | 10% to 20% | 40% to 50% |
These figures represent ranges informed by available data but should be understood as illustrative rather than precise forecasts. The full inflationary impact of tariffs has not materialized, the geopolitical situation introduces a wide band of energy price outcomes, and the Fed leadership transition adds institutional uncertainty that could shift any scenario materially.
What to Watch Next
The stagflation-real-estate thesis rests on a convergence of weakening employment, persistent inflation, and frozen monetary policy. Whether this convergence deepens or dissipates depends on a handful of measurable indicators over the next sixty to ninety days.
1. March 2026 Non-Farm Payrolls. February’s report was a shock. A single month of job losses can reflect seasonal distortion, so the March print is the critical validation point. If payrolls contract again or recover only modestly below 50,000, it would suggest genuine labor-market deterioration. A rebound above 150,000 with stable unemployment would weaken the stagflation case considerably. Watch also for revisions to the February figure.
2. February Core PCE Release. A third consecutive increaseparticularly one pushing core PCE to 3.2 percent or higherwould cement the stagflation narrative. If core PCE instead holds steady or declines, it would suggest the January reading was a temporary spike and give the Fed more room to prioritize employment.
3. Fed Dot Plot and FOMC Statement Language. The key signal is whether the dot plot shifts toward zero cuts or whether the statement language explicitly acknowledges a dual-mandate tension. Any insertion of phrases suggesting the Committee sees inflation risks as “persistent” while noting “softening labor conditions” would be textual confirmation of the stagflation bind. A change in Fed leadership toward Warsh could alter the rate path materially.
4. MBA Mortgage Application Volume and Pending Home Sales. These offer the most real-time signal of residential transaction activity. A sustained decline of 10 percent or more in the MBA purchase index over a four-week rolling average, combined with month-over-month drops in pending sales, would indicate the housing market is actively freezing. No specific current data on these metrics was available in the reviewed sources.
5. CMBS Delinquency Rates and CRE Loan Modification Filings. A rise in CMBS delinquency rates above post-pandemic highs, or a notable spike in modification and extension filings, would signal distress migrating beyond isolated office-sector problems. The reviewed sources did not provide current CMBS delinquency figures; this remains an area where direct data should be sought from servicer reports and rating-agency surveillance.
If three or more of these indicators flash warning signals simultaneously, the stagflation-real-estate thesis moves from plausible scenario to operating reality. If the majority instead show stabilization, the current moment may prove to be elevated uncertainty rather than a structural regime change.
Conclusion
Generated supporting visual
The evidence available as of March 2026 establishes a clear and uncomfortable set of boundary conditions for real estate. Core PCE inflation at 3.1 percent and rising, an unexpected loss of 92,000 jobs, unemployment at 4.4 percent, a Federal Reserve boxed in by contradictory mandates, unresolved tariff passthrough, and an energy shock from the Iran conflictthese are not hypothetical risks. They are documented conditions, reported by TreasurySpring and verified through official data releases, that together define a stagflationary environment with direct and measurable consequences for property markets.
The stagflation-real-estate relationship is not one of uniform decline. Distress concentrates where structural oversupply meets cyclical demand destruction and refinancing walls: Class B and C office, speculative Sun Belt multifamily, and discretionary retail face the most acute pressure. Relative resilience clusters around necessity retail, near-shoring-linked industrial, and affordable housing, where demand is either inelastic or countercyclical and where inflation-linked rent structures provide partial income protection.
What remains genuinely unknown is whether this moment represents the beginning of a deeper deterioration or a peak of uncertainty that resolves through favorable data in the months ahead. The duration and inflationary impact of the Iran conflict, the timing and magnitude of tariff passthrough, the outcome of the Fed leadership contest between Powell and Warsh, and whether the March payroll data confirms or contradicts February’s shockall of these remain open questions. The distress in this cycle is unlikely to resemble the dramatic mark-to-market collapse of 2008. It is more likely to be slow, hidden, and masked by nominal price resilience until refinancing walls and credit deterioration force recognition.
The next sixty to ninety days of data will be unusually consequential. Investors, borrowers, and policymakers should treat the scenarios outlined here as a framework for managing risk, not as predictions, and update assumptions as evidence accumulates.
Frequently Asked Questions
How does stagflation affect home prices differently than a normal recession? In a normal recession, falling demand eventually pulls inflation lower, giving the Fed room to cut rates and support asset prices. In stagflation, inflation stays elevated even as the economy weakens, which constrains the Fed from cutting. The result is that nominal home prices may hold roughly steadypropped up by replacement costs and inflationbut real, inflation-adjusted values erode. Transaction volumes compress because buyers and sellers cannot agree on pricing when the cost of capital is both high and uncertain.
Will mortgage rates come down in 2026 if the economy weakens? Not necessarily. As of March 2026, the FOMC signaled at most one rate cut for the year, and TreasurySpring noted that traders were pricing in slightly over two. The Fed’s ability to cut is constrained by core PCE inflation at 3.1 percent, unresolved tariff effects, and energy price pressures from the Iran conflict. Mortgage rates, which are benchmarked to the 10-year Treasury yield, are unlikely to decline meaningfully unless inflation decelerates first.
Which real estate sectors are most at risk during stagflation? Based on the macro conditions documented by TreasurySpring and established sector characteristics, Class B and C office properties face the highest distress risk due to compounding secular demand decline, rising unemployment, and refinancing walls. Speculative Sun Belt multifamily is the next most exposed, followed by discretionary retail. Necessity retail, affordable housing, and near-shoring-linked industrial show relative resilience.
Should I buy a home now or wait for rates to drop? The available evidence does not support a confident prediction that rates will drop meaningfully in 2026. The base-case scenario suggests mortgage rates hovering between 6.5 and 7.0 percent through the year. Waiting carries the risk that rates remain elevated while prices hold steady or rise nominally due to inflation. Buying carries the risk of purchasing into a weakening labor market with limited refinancing upside. Individual decisions depend on personal financial circumstances, job security, and time horizonfactors beyond the scope of macroeconomic analysis.
What happens to commercial real estate loans maturing in a stagflationary environment? Borrowers who originated CRE debt at sub-4 percent rates during 20212022 now face refinancing at 6.5 percent or above, while net operating income may be declining due to rising vacancy and weakening tenant demand. This combination can push loan-to-value ratios above lender thresholds, triggering covenant violations, forced sales, or loan modifications. Regional banks, lower-rated CMBS holders, and overleveraged private equity sponsors are the most exposed entities.
How does rising unemployment affect rental markets and landlords? Rising unemployment erodes tenant income and confidence, increasing the risk of missed rent payments, lease non-renewals, and rising vacancy. This is most acute in commercial marketsparticularly office and discretionary retailwhere tenant demand is directly linked to employment levels. In residential rental markets, landlords in luxury and speculative segments face the greatest concession pressure, while affordable and workforce housing may see relatively stable demand as displaced homebuyers and cost-conscious households shift toward lower-cost rentals.
Is real estate still an inflation hedge during stagflation? Partially. Inflation supports nominal asset values, replacement costs, and rents in segments with inflation-linked lease structures such as necessity retail and affordable housing. However, the “hedge” breaks down when inflation is accompanied by rising unemployment and frozen monetary policy, because transaction volumes collapse, credit tightens, and real returns erode. The inflation-hedge thesis holds best for properties with strong cash flows, low leverage, and inelastic tenant demand.
What are the warning signs that stagflation is getting worse for property markets? Five indicators to monitor: continued job losses in the March 2026 payroll report, a third consecutive core PCE increase, Fed statement language acknowledging a dual-mandate tension, sustained declines in MBA mortgage application volume, and rising CMBS delinquency rates. If three or more of these flash warning signals simultaneously, the stagflation-real-estate thesis moves from plausible scenario to operating reality.