
US-Iran Conflict & Tech Correction: Equity Market Impacts
The US-Iran Conflict & Tech Correction: Navigating the Macroeconomic Shock
A projected abrupt closure of the Strait of Hormuz in March 2026 would transform a localized geopolitical standoff into a global macroeconomic shock, instantly repricing inflation expectations and halting the Federal Reserve’s anticipated easing cycle. This hypothetical supply-side paralysis would fundamentally alter the risk calculus for investors, shifting the prevailing market narrative from a comfortable soft-landing scenario to a stagflation-wary environment. At the center of this projected paradigm shift is the US-Iran Conflict & Tech Correction, a dual-front crisis where physical supply chain bottlenecks could mechanically trigger a severe valuation reset in long-duration financial assets. Consequently, nearly $14 trillion could be wiped from global equity markets in a single month as capital flees risk assets, according to projections by BENDURA BANK AG. The sheer velocity of this modeled wealth destruction underscores how deeply modern equity valuations rely on the fragile assumption of uninterrupted global trade and imminent monetary easing.
To navigate this potential new regime, investors must separate emotional market reactions from underlying mathematical realities. A disruption of global energy arteries would act as a regressive tax on consumers and a ruthless margin-compressor for average corporations. Stripped of their flexibility by re-accelerating headline inflation, central bankers would be forced into a defensive posture, fracturing Wall Street’s consensus and leaving markets highly vulnerable to further volatility as they attempt to price in a “higher for longer” reality.
The Transmission Chain: From Chokepoint to Multiple Compression
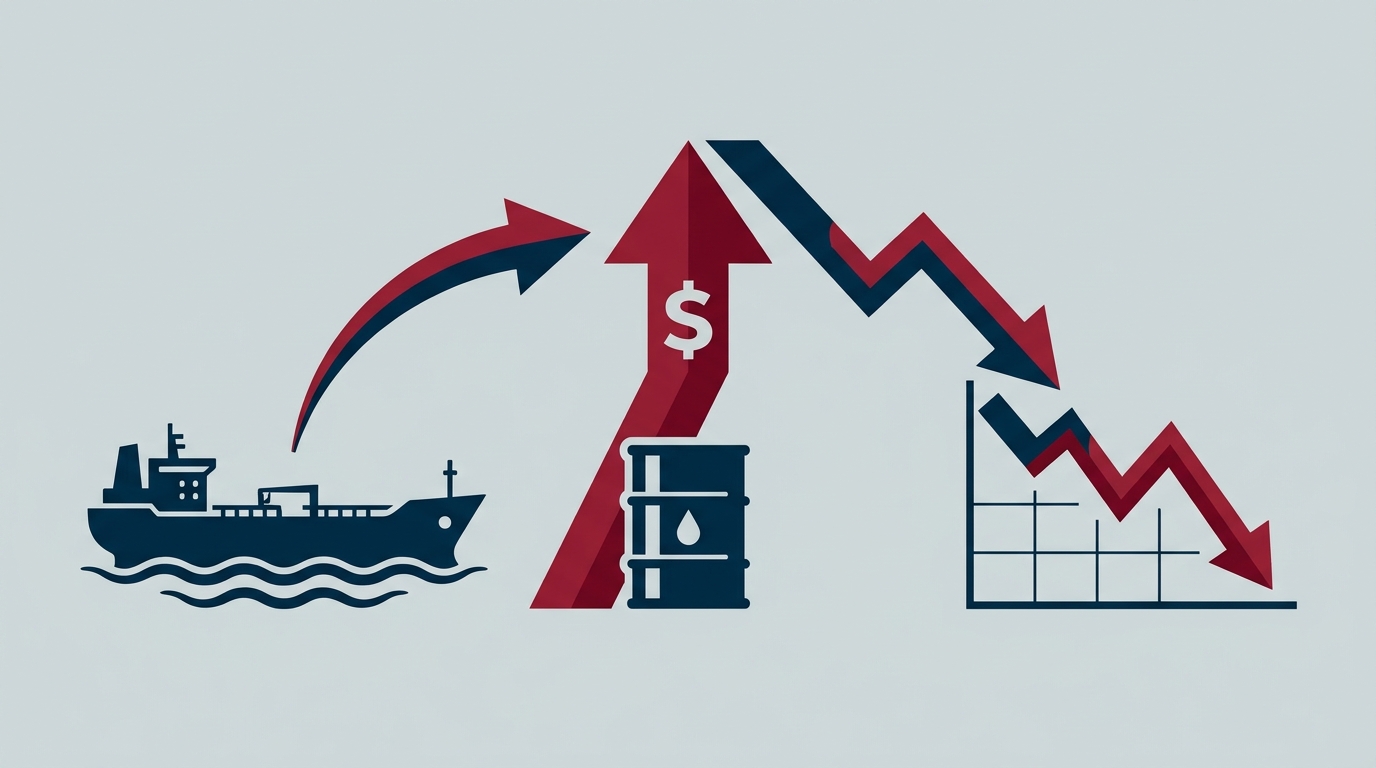
The transmission chain of such a geopolitical shock follows a highly predictable, three-stage path, beginning with a severe bottleneck in global energy infrastructure, cascading into consumer prices, and ultimately forcing a structural repricing of equity valuations.
Stage 1: The Physical Energy Bottleneck The catalyst for this fundamental deterioration would be a sudden, defensive closure of the Strait of Hormuz by Iran. This maritime chokepoint is critical infrastructure, responsible for facilitating the transit of approximately 20% of the world’s daily oil supply, according to BENDURA BANK AG. Alternative supply routes simply cannot rapidly absorb a volume deficit of this magnitude. For US investors, the immediate implication would be a structural repricing of crude oil risk premiums. Even if a disruption proves temporary, the shock would establish a higher baseline for near-term energy costs, directly transferring capital from energy consumers to energy producers.
Stage 2: The Inflationary Echo The secondary link in this chain is the direct mathematical translation of energy shocks into broader consumer price inflation. The economic transmission mechanism is highly predictable: quantitative estimates indicate that a sustained $10 per barrel increase in crude oil prices mechanically adds approximately 0.3 to 0.4 percentage points to overall headline inflation, according to BENDURA BANK AG. However, the analytical concern extends well beyond the price at the gas pump. Energy costs inevitably bleed into core inflation metrics through elevated transportation, manufacturing, and logistics expenses. For market participants, this means an inflationary echo would likely persist in corporate earnings reports for several quarters, regardless of how quickly the geopolitical conflict resolves. Companies lacking the pricing power to pass these costs onto consumers would face severe and immediate margin compression.
Stage 3: Monetary Paralysis and the Tech Sell-off Renewed inflationary pressure would effectively force the Federal Reserve to abandon its anticipated rate-cut trajectory, creating the third and most financially destructive link in the transmission chain. Stripped of its flexibility, the central bank would likely hold the benchmark interest rate steady at projected levels of 3.5% to 3.75% during its March 17-18 meeting, per forecasts by BENDURA BANK AG.
The evaporation of expected rate cuts would directly trigger a severe, valuation-driven correction, particularly in the technology sector. Technology stocks are inherently long-duration assets; their premium valuations are highly sensitive to the discount rates used to calculate the present value of future cash flows. If the prospect of cheaper capital vanishes, the elevated multiples assigned to the tech sector become mathematically unsustainable. This would prompt a mechanical sell-offpotentially driving the Nasdaq composite down 4.75% into correction territoryrather than a decline driven by deteriorating corporate earnings, as modeled by BENDURA BANK AG. Higher risk-free rates mathematically reduce the present value of future corporate cash flows, disproportionately punishing growth-dependent sectors that rely on cheap capital to fund long-term expansion.
Highest-Signal Evidence: Isolating the Macro Data
A projected macroeconomic landscape for March 2026 is defined by a severe geopolitical shock colliding with surprisingly resilient domestic US economic data. To outline this hypothetical scenario, the table below isolates the modeled highest-signal data points for the month. While the market’s forward-looking assumptions remain highly volatile, these baseline forecast figures would dictate the immediate policy environment for the Federal Reserve and asset allocators.
| Macroeconomic Metric | Projected March 2026 Data | Analytical Context & Primary Driver |
|---|---|---|
| Headline CPI (MoM) | +0.9% | Largest projected jump since 2022, driven directly by the hypothetical geopolitical energy shock. |
| Core CPI (MoM) | +0.2% | Underlying inflation remains benign in models, isolating the acute shock to energy. |
| Non-farm Payrolls | +178,000 | Forecast demonstrates structural labor market resilience despite external risks. |
| Unemployment Rate | 4.3% | Projected to tick downward, providing the Fed cover to maintain restrictive rates. |
| Global Equity Markets | -$14 Trillion | Modeled broad repricing of stagflation risks and corporate margin compression. |
The Inflation Divergence The most immediate transmission mechanism of this simulated geopolitical crisis into the US economy would be visible in inflation data. In this scenario, headline CPI surges by an estimated 0.9% month-over-month in March, marking the largest projected monthly increase since 2022 due almost entirely to soaring gasoline costs, according to forecasts by J.P. Morgan Global Research. However, core CPI is modeled to increase by a relatively benign 0.2%. This divergence is critical: it indicates that acute inflationary pressure would not yet have broadened into services and core goods, per J.P. Morgan Global Research. For investors, the critical metric to monitor would be the duration of such an energy spike. If the strait were to remain closed, a sustained energy tax would inevitably compress discretionary corporate margins in the coming quarters.
Labor Market Resilience Despite modeled external shocks, projections suggest the US labor market would demonstrate persistent structural strength, complicating the narrative of an imminent economic contraction. In this scenario, employers add 178,000 non-farm payrolls in March, and the unemployment rate ticks down to 4.3%, per estimates by J.P. Morgan Global Research. This resilience would act as a double-edged sword. It would confirm the underlying domestic economy was fundamentally sound prior to the Middle Eastern energy shock. However, a tight labor market would provide the Federal Reserve with the necessary economic cover to prioritize inflation containment over growth stimulation. Investors should not expect a resilient labor market to force an early dovish pivot from the central bank.
Market Breadth and the Equal-Weight Collapse The collision of rising energy-driven inflation and a hawkish monetary outlook would trigger a massive repricing of risk assets. Beyond the headline indiceswith the S&P 500 projected to fall 5.09% and the Dow dropping 5.38%the underlying market breadth would reveal a troubling second-order effect, notes BENDURA BANK AG. In this model, the equal-weight S&P 500 ETF falls 6.2% in March, underperforming the cap-weighted index for the first time in five weeks, according to BENDURA BANK AG.
This widespread deterioration would indicate that the pain broadly impacts the average stock. Smaller and mid-sized enterprises typically carry higher floating-rate debt burdens and possess less robust balance sheets, making them highly sensitive to sustained borrowing costs. While cash-rich mega-cap technology companies operate with fortress balance sheets, the median companies dominating the equal-weight index lack both the pricing power to pass on sudden energy costs and the cash buffers to ignore elevated interest rates. This divergence implies that such a sell-off would be exceptionally broad-based, punishing average stocks more severely while investors seek relative safety in mega-cap equities.
Scenario Analysis: Navigating a Fractured Consensus
A stark disconnect could emerge between Wall Street’s monetary policy forecasts and the Federal Reserve’s official guidance, creating a highly volatile backdrop for US investors in the second quarter of 2026. This potential institutional divergence signals a forward-rate environment where investors could no longer price in guaranteed monetary easing.
The Base Case: Prolonged Stasis and Leadership Transition A base case scenario for Q2 2026 dictates that the Federal Reserve would hold interest rates steady in the 3.5% to 3.75% range, primarily driven by the persistence of sticky energy inflation. Modeled near-term futures pricing heavily supports this stagnation. Forecasts using the CME FedWatch tool indicate a 99.5% probability of no rate change at the April meeting, followed by a 96% chance of a hold in June and an 87% chance in July, according to Southeast AgNet.
Complicating this holding pattern is a scheduled leadership transition. Chairman Jerome Powell’s term expires in May 2026, making the April gathering his final meeting, notes Southeast AgNet. An incoming Fed chair would inherit a restrictive policy stance and would likely be reluctant to pivot prematurely without definitive proof of disinflation. Consequently, US markets should anticipate elevated short-term yields persisting through the summer, continuing to pressure highly leveraged corporate borrowers.
The Upside Scenario: Geopolitical Resolution and Late-Year Cuts In an upside scenario, a swift diplomatic or military resolution to a potential Strait of Hormuz closure would act as a powerful deflationary catalyst. A rapid normalization of oil transit would strip the geopolitical premium from crude prices, subsequently dragging down headline CPI metrics. This disinflationary relief would provide the Federal Reserve with the necessary macroeconomic cover to execute the easing cycle modeled by major brokerages.
Currently, institutions including Goldman Sachs, BofA Global Research, and Barclays are modeling two cuts for 2026, with the first easing anticipated in September, per Reuters. The second-order effect of this scenario would be a steepening of the yield curve, as short-term rates drop while long-term growth expectations recover. This environment would strongly favor rate-sensitive sectors such as small-cap stocks, which have been historically constrained by elevated borrowing costs.
The Downside Scenario: Structural Stagflation and 2027 Rate Hikes The downside scenario hinges on a sustained conflict in the Middle East that keeps the Strait of Hormuz closed, driving a structural re-acceleration of inflation. Prolonged energy supply shocks would force the Federal Reserve to abandon its easing projections entirely. This validates Deutsche Bank’s revised outlook, which expects no rate cuts throughout 2026, according to Reuters.
If secondary inflation effects seep into core services and wages, the central bank may be forced to entertain further tightening. Analysts at J.P. Morgan Global Research forecast the Fed could hold rates steady through the end of the year, eventually projecting a 25 basis point hike in the third quarter of 2027 under these conditions. This stagflationary environment would severely punish traditional 60/40 portfolios, as rising yields would simultaneously crush bond valuations and compress equity multiples.
What to Watch Next: Concrete Indicators for Q2
Market participants approaching the April 2026 Federal Open Market Committee (FOMC) meeting would face an environment defined by monetary stasis. To determine whether a technology sector correction would stabilize or deepen into a broader bear market, investors must monitor a specific checklist of energy and macroeconomic triggers.
- The Energy-to-Headline CPI Threshold: Because current data lacks precise future dollar-per-barrel oil targets, investors should use the projected 0.9% headline CPI jump as a proxy threshold. If modeled monthly energy price increases consistently push headline CPI near or above this 1.0% mark, the risk of a prolonged equity selloff rises significantly. Any stabilization in tech valuations would require clear evidence that crude supply chains are normalizing.
- Core CPI Bleed-Over: The secondary trigger involves the potential bleed-over of fuel costs into core inflation. If future core CPI prints begin to accelerate past the projected 0.2% baseline, it would signal that higher transportation and energy costs are becoming entrenched in broader services and goods. Investors should view consecutive core CPI increases as a definitive signal to shift from growth equities into more defensive, cash-flow-positive assets.
- Labor Market Resilience: A labor market holding near 4.3% unemployment while energy shocks persist means the Federal Reserve would be structurally forced to maintain restrictive yields. A sudden spike in unemployment would complicate the Fed’s dual mandate, but until that occurs, inflation containment remains the priority.
- The May Fed Leadership Transition: The scheduled expiration of Powell’s term introduces a critical vacuum in forward guidance precisely when energy markets could be dictating domestic inflation, according to Southeast AgNet. The identity and initial policy tone of the successor would immediately reprice bond markets.
Conclusion
The projected events of March 2026 signal a critical potential regime change where macroeconomic and geopolitical factors override company-specific fundamentals in determining asset prices. In this scenario, the US-Iran Conflict & Tech Correction is not merely a sentiment-driven panic, but a rational, mathematical adjustment to a world where capital is no longer cheap and supply chains are no longer guaranteed.
The analytical takeaway for investors is clear: the traditional safe havens and diversification strategies of the previous decade are uniquely vulnerable to this specific macroeconomic storm. Rotating into the equal-weight S&P 500 would behave more like a value trap than a defensive maneuver, as average-sized companies face a ruthless margin squeeze from elevated floating-rate debt and surging input costs. Until a resolution in the Strait of Hormuz restores the flow of oil and strips the geopolitical premium from headline inflation, market participants must defensively position their portfolios. Investors are best served by treating such market weakness not as a standard dip-buying opportunity, but as a structural repricing of a higher-for-longer capital environment, prioritizing pristine balance sheets and high margin resilience above all else.
Disclaimer: This analysis is for informational purposes only and does not constitute investment, financial, real estate, or legal advice. Always consult a licensed financial advisor before making investment decisions.
FAQ
How does a potential closure of the Strait of Hormuz directly impact the Nasdaq and tech stock valuations? A theoretical closure would choke off 20% of global oil supply, driving up energy prices and headline inflation. This would force the Federal Reserve to halt expected interest rate cuts, keeping borrowing costs elevated. Because tech stocks are long-duration assets whose premium valuations rely heavily on low discount rates, the evaporation of cheap capital mathematically reduces the present value of their future cash flows, triggering a mechanical sell-off.
Why is the equal-weight S&P 500 considered more vulnerable to this specific oil shock than the standard market-cap weighted index? The equal-weight index is dominated by average-sized companies that typically carry higher floating-rate debt burdens and have less pricing power than mega-cap tech giants. These median companies would face a severe margin squeeze: they must absorb the rising transportation and logistics costs caused by an oil shock while simultaneously paying higher interest on their debt due to the Fed’s restrictive policy.
Will the Federal Reserve still cut interest rates in 2026 despite a geopolitical inflation spike? Consensus is deeply fractured. While brokerages like Goldman Sachs and BofA project rate cuts beginning in late 2026, institutions like Deutsche Bank forecast no cuts for the year, and J.P. Morgan projects rates could hold steady until a potential hike in late 2027. The Fed’s path depends entirely on whether an energy shock bleeds into core inflation.
What specific oil price levels should investors monitor to predict the Federal Reserve’s next policy move? While exact dollar-per-barrel targets are fluid, investors should monitor the translation of oil prices into headline CPI. A sustained $10 per barrel increase mechanically adds 0.3 to 0.4 percentage points to inflation. Investors should watch if monthly headline CPI consistently approaches or exceeds the projected 0.9% jump modeled for March, as this level of sustained energy inflation would force the Fed to maintain or increase restrictive rates.