
FOMC Dissent: Navigating the Fed's Historic Policy Fracture
FOMC Dissent: Navigating the Fed’s Historic Policy Fracture
The April 2026 Federal Open Market Committee (FOMC) meeting marks a critical inflection point for US markets, officially dissolving the prevailing assumption of a unified Federal Reserve reaction function. By holding the target federal funds rate steady at 3.5% to 3.75% against the backdrop of four official objections, the central bank experienced its most divided meeting since October 1992, as noted by Hiring Lab. This historic FOMC Dissent matters profoundly for market participants because it replaces reliable forward guidance with structural uncertainty. The breakdown in consensuswith three dissenters leaning hawkish and one advocating for an immediate cutexplicitly signals a fractured policy regime. Investors must now price in the risk of central bank paralysis, where the Fed’s inability to agree on a baseline macroeconomic narrative delays decisive action and fundamentally alters the outlook for Treasury yields and equity multiples.
For the better part of three decades, financial markets have operated under the assumption that the Federal Reserve would present a united front, providing clear, telegraphed signals regarding the cost of capital. That era has abruptly ended. The current polarization indicates that the Fed is struggling to distinguish between transitory supply shocks and entrenched, structural inflation. Consequently, investors are forced to simultaneously hedge against both a resurgence of price pressures and a sudden growth contraction, requiring an immediate recalibration of portfolio risk.
The Transmission Chain: From Policy Fracture to Equity Repricing
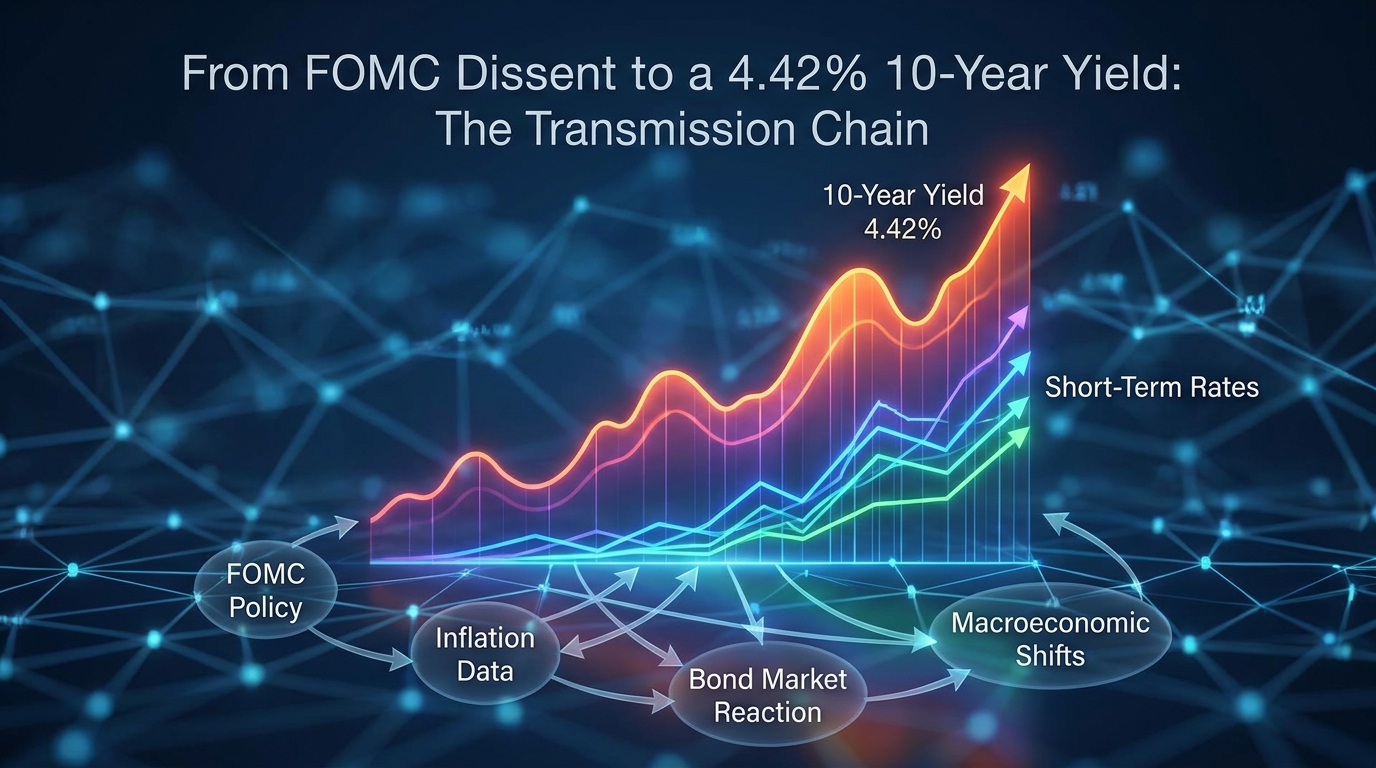
The transmission of this unprecedented policy ambiguity into the real economy follows a distinct mechanical path: a breakdown in forward guidance leads to higher term premiums, which steepens the yield curve, ultimately forcing a severe compression of equity valuation multiples.
This combination of resilient economic data and fractured forward guidance has triggered a sharp repricing in the bond market. By early 2026, the U.S. Treasury yield curve steepened to its widest level since November 2021, with the 2-year/10-year spread expanding to near 70 basis points, according to Ainvest. After spending much of the prior three years in an inverted or flat state, this structural steepening reflects a shifting macroeconomic consensus, as noted by Zacks.
Investors are now demanding a higher term premium to hold long-dated government debt. They are anticipating that long-term rates will remain stubbornly high even if short-term policy easing eventually occurs, per Ainvest. The second-order effect of this normalization is a stricter capital environment, as the cost of long-term borrowing resets to levels that will fundamentally test corporate balance sheets across the broader economy.
The impending leadership transition at the Federal Reserve acts as a powerful accelerant to this transmission chain. Jerome Powell’s second term as Federal Reserve Chair is set to expire in May 2026, right as internal consensus has completely unraveled, according to Hiring Lab. The nomination of Kevin Warsh as the next Chair is actively reshaping long-term market expectations. Warsh has historically been a vocal advocate for shrinking the central bank’s balance sheet and significantly reducing its intervention in the bond market, as highlighted by Zacks.
Market participants are pricing in the high probability that a Warsh-led Fed would step back as a primary buyer of U.S. Treasuries. This anticipated withdrawal of official sector support forces private investors to absorb a greater share of the debt supply, requiring greater compensation to clear the market without a price-insensitive buyer.
The culmination of these factors is acute upward pressure on the 10-year Treasury yield. Recent market data recorded the 10-year yield at an elevated 4.18%, a level that acts as a direct mathematical cap on valuation multiples, with the potential to push toward a 4.42% threshold, according to Ainvest. Because the 10-year yield serves as the risk-free discount rate in standard financial models, its ascent disproportionately penalizes long-duration growth stocks whose anticipated cash flows are weighted heavily in the distant future, per Ainvest. As yields climb higher, the present value of those distant earnings compresses, forcing a mechanical derating of high-multiple equities and pushing capital toward sectors with near-term cash flows and tangible assets.
The Highest-Signal Evidence: Credit Expansion and Unanchored Expectations
The catalyst empowering the hawkish dissentersand paralyzing the broader committeeis a matrix of highly contradictory macroeconomic data. Current policy appears simultaneously too tight for some sectors and highly accommodative for others.
The most glaring signal that current policy may not be sufficiently restrictive is the surprising re-acceleration in private sector credit. Total bank loan growth accelerated notably throughout the previous year, rising from a 2.7% year-over-year pace in early 2025 to approximately 5.4% by late November, according to Zacks. When businesses and consumers continue to borrow at an accelerating rate despite a 3.5% to 3.75% federal funds rate, it strongly implies that the policy rate is no longer functioning as a restrictive anchor. This robust credit appetite undermines the prevailing narrative that the economy is cooling, giving policymakers ample empirical cover to maintain or even raise rates further.
Compounding the threat of accelerating credit is the weakening of the Federal Reserve’s inflation anchor, driven by localized price shocks. In March 2026, headline inflation accelerated to 3.3% year-over-year, heavily driven by a severe 21% month-over-month spike in gas prices during February, according to Hiring Lab.
More concerning for long-term policy is the psychological shift among consumers. Data from the Federal Reserve Bank of New York shows both median 3-year-ahead and 5-year-ahead consumer inflation expectations converging around 3% in early 2026, as reported by Hiring Lab. If long-term expectations become entrenched at 3%, the “higher-for-longer” framework transitions from a temporary cyclical posture to a permanent structural necessity to prevent spiraling wage-price dynamics.
| Macroeconomic Shift | Timeline | Key Data Point | Analytical Implication |
|---|---|---|---|
| Bank Loan Expansion | Early 2025 to Late Nov 2025 | Accelerated from 2.7% to 5.4% YoY | Current policy rate is not sufficiently restrictive to cool aggregate demand. |
| Energy Price Shock | February 2026 to March 2026 | Gas spiked 21% MoM; Headline CPI hit 3.3% YoY | Exogenous supply shocks are driving a re-acceleration in headline figures. |
| Inflation Expectations | Early 2026 | 3-year and 5-year converged at 3% | Consumer psychology is actively de-anchoring from the Fed’s 2% target mandate. |
These macroeconomic shifts reveal a deeply bifurcated economy that defies traditional monetary models. This conflicting data matrix perfectly illustrates why three policymakers are signaling potential rate hikes while one demands an immediate cut. Without a unified interpretation of this data, fixed-income investors are left exposed to elevated directional risks.
Scenario Analysis: Navigating a Structurally Altered Market

Given the restrictive fixed-income dynamics and the breakdown in central bank consensus, investors must map out clear scenarios to navigate the shifting risk-reward calculus.
The Base Case: Multiple Compression and a Flight to Quality The highest probability outcome centers on continued valuation compression and a distinct sector rotation. With three dissenters leaning hawkish, the probability of a near-term rate cut has diminished significantly. The elevated 4.18% yield on the 10-year Treasury will continue to act as a gravitational pull on equity multiples, according to Ainvest. Capital will continue migrating away from long-duration growth and toward defensive sectors characterized by near-term cash flows, tangible assets, and demonstrated pricing power, per Ainvest. In this environment, investors are no longer willing to subsidize unprofitable growth; they demand immediate capital returns. Portfolio anchors must be businesses capable of self-funding operations and passing elevated costs onto consumers without sacrificing margins.
The Upside Scenario: Productivity-Driven Disinflation While the base case favors defensive posturing, a distinct upside scenario exists for long-duration equities if macroeconomic conditions unexpectedly shift. The primary catalyst for this bullish reversal would be a scenario where structural, technology-driven productivity gains successfully push core inflation below the Federal Reserve’s 2% target. If this disinflationary trend materializes, it could allow the central bank to cut rates more aggressively, triggering a “bull-flattening” of the yield curve, as noted by Ainvest. Under these conditions, the discount rate pressure on long-duration growth stocks would rapidly ease, allowing their valuation multiples to stabilize and expand. However, investors must treat this scenario with caution, as the timing and magnitude of such productivity gains remain highly uncertain and difficult to measure in real-time.
The Downside Scenario: Runaway Yields and Policy Paralysis The downside scenario involves a severe deterioration of equity valuations driven by runaway long-term yields and central bank paralysis. If inflation remains stickyfueled by unanchored 3% expectations and >5% bank loan growthand the fractured FOMC cannot reach a consensus on policy intervention, the 10-year Treasury yield could break significantly higher than its current 4.18% level, potentially testing the 4.42% threshold. Such an uncontrolled rise in the cost of capital would likely bypass targeted multiple compression and trigger a broader, indiscriminate equity sell-off. The uncertainty surrounding the Fed’s leadership amplifies this risk; if Kevin Warsh’s confirmation is delayed, or if his commitment to balance sheet reduction spooks the market, a lack of clear forward guidance could cause bond markets to demand even higher term premiums. In this scenario, even the protective characteristics of tangible assets would offer limited shelter against rising debt-servicing costs.
What to Watch Next: Leading Indicators for the Next Policy Phase

With official FOMC forward guidance effectively paralyzed until a new consensus forms, market participants must shift their focus to a specific set of concrete macroeconomic and leadership indicators to anticipate the next policy phase.
- NY Fed Consumer Inflation Expectations: Following the 21% month-over-month spike in February gas prices, according to Hiring Lab, investors must watch the Federal Reserve Bank of New York’s upcoming reports. Median 3-year and 5-year expectations have already converged at 3%. If these medium-term expectations drift higher in response to the energy spike, it would signal that inflation psychology is becoming thoroughly unanchored, almost certainly validating the hawkish dissenters and accelerating the ‘higher-for-longer’ regime.
- Weekly Commercial Bank Loan Growth: This metric serves as a real-time proxy for economic overheating and credit demand. Throughout late 2025, loan growth accelerated to 5.4%, as reported by Zacks. If commercial lending continues to expand at a 5% or higher annualized rate, it injects further liquidity into the economy, directly counteracting the Fed’s mandate. A sustained acceleration here provides the empirical justification needed for a rate hike.
- Kevin Warsh’s Senate Confirmation Hearings: The US Senate is aiming to confirm Warsh before the crucial June 2026 FOMC meeting, per Hiring Lab. Investors must scrutinize his testimony as a proxy for future monetary architecture. If Warsh explicitly commits to aggressive quantitative tightening and reducing bond-market intervention, as noted by Zacks, it will likely steepen the yield curve further by driving up long-end Treasury yields, signaling tighter financial conditions regardless of where the short-term federal funds rate sits.
Conclusion
The April 2026 policy decision fundamentally rewrites the rules of engagement for US markets. The era of heavy central bank subsidization and predictable forward guidance has officially concluded, replaced by a structurally altered landscape where the cost of capital is dictated by bond market vigilantism rather than unified committee dot plots. The unprecedented FOMC Dissent proves that the central bank is struggling to reconcile a deeply bifurcated economy, caught between accelerating credit growth and unanchored consumer expectations. For investors, the analytical takeaway is clear: valuation discipline is no longer optional. With the 10-year Treasury yield exerting immense gravitational pull on equity multiples, and a looming leadership transition threatening to further withdraw liquidity support, market participants must anchor their portfolios in tangible, cash-generating assets. Until the internal divisions within the Federal Reserve are resolved and long-term rates find a definitive ceiling, equity markets will remain highly sensitive to every macroeconomic data release, punishing speculative duration and rewarding present-day profitability.
Disclaimer: This analysis is for informational purposes only and does not constitute investment, financial, real estate, or legal advice. Always consult a licensed financial advisor before making investment decisions.
FAQ
Why is a four-way FOMC dissent considered unprecedented, and why does it spook markets? A four-way dissent is the highest level of internal disagreement recorded at a single FOMC meeting since October 1992. It spooks markets because it shatters the illusion of monetary consensus, replacing reliable forward guidance with structural uncertainty. This polarization indicates the Fed is struggling to interpret conflicting macroeconomic data, leaving investors unsure if the next policy move will be a rate hike or a cut.
How does a 4.42% 10-year Treasury yield specifically impact long-duration growth stocks versus value stocks? The 10-year Treasury yield serves as the risk-free discount rate in standard financial valuation models. As this yield climbs toward 4.42%, it disproportionately penalizes long-duration growth stocks because their anticipated cash flows are weighted heavily in the distant future; a higher discount rate severely compresses the present value of those distant earnings. Conversely, value stocks with near-term cash flows and tangible assets are better insulated against rising discount rates.
What role does Kevin Warsh’s nomination for Fed Chair play in the current steepening of the yield curve? Kevin Warsh has historically advocated for shrinking the central bank’s balance sheet and reducing its intervention in the bond market. Market participants are pricing in the probability that a Warsh-led Fed will step back as a primary buyer of U.S. Treasuries. This anticipated withdrawal of official sector support forces private investors to absorb more debt supply, requiring higher long-end yields (a higher term premium) to clear the market, thereby steepening the yield curve.
If consumer inflation expectations are anchored at 3%, what does that mean for the ‘higher-for-longer’ rate narrative? If median 3-year and 5-year consumer inflation expectations converge and anchor around 3%well above the Fed’s 2% mandateit suggests consumers are psychologically adjusting to higher baseline inflation. This means the “higher-for-longer” rate narrative transitions from a temporary cyclical posture to a permanent structural necessity, as the Fed must maintain restrictive rates indefinitely to prevent spiraling wage-price dynamics.