
Analyzing the 30-Year Treasury 5% Impact on US Equities
Navigating the Hypothetical 30-Year Treasury 5% Threshold and Equity Valuations
In a hypothetical projection, a breach of the 30-Year Treasury 5% threshold could alter the underlying mathematics of US equity valuations, signaling a potential shift in market dynamics. Modeled for May 2026, long-term yields surpass this critical mark for the first time since the summer of 2025, according to Business Insider. This projected upward trend reflects a structural repricing of monetary policy expectations. Within a single month of this modeled timeline, market probabilities for the Federal Reserve to lower interest rates in 2026 plummeted from 20% to approximately 8%, as noted by Business Insider. Simultaneously, the odds of a renewed rate hike spiked, prompting institutional allocators to adjust expectations for liquidity relief. This event challenges the prevailing consensus, suggesting a new baseline where risk-free assets offer an absolute return that competes directly with the stock market.
The Transmission Chain: From Risk-Free Rates to Equity Valuations
To understand how sovereign bond yields influence stock prices, investors can visualize a conceptual seesaw. On one side sits the long-term risk-free rate; on the other rests the valuation multiples of risk assets. Rising risk-free yields push the present value of future corporate cash flows downward, acting as a strong downward pressure on valuations.
This transmission chain operates primarily through the mechanics of the discount rate. In financial modeling, higher risk-free yields increase the discount rate applied to future corporate earnings. This effect is particularly notable for long-duration equities, such as high-multiple growth and technology stocks, which typically trade at premium valuations because investors anticipate outsized cash flows a decade or more down the line.
When the discount rate applied to those distant earnings is anchored by a 5% risk-free alternative, the present value of those future cash flows decreases. This reduces the valuation premium previously afforded to the tech sector during periods of highly accommodative monetary policy. As premium multiples become harder to justify, capital may be encouraged to rotate away from growth-oriented stocks.
Beyond growth stocks, a 5% risk-free rate prompts a repricing of traditional dividend-paying equities, often referred to as “bond proxies.” Sectors such as utilities, real estate investment trusts (REITs), and consumer staples have historically attracted capital by offering steady dividend yields. Yet, when a sovereign-backed instrument offers a 5% return, the foundational investment case for these dividend proxies weakens. Investors become less incentivized to absorb equity market risk, corporate governance concerns, or earnings volatility, shifting the comparative risk/reward profile in favor of fixed income.
| Investment Characteristic | 5% Risk-Free Yield (30-Year US Treasury) | Traditional Dividend-Paying Stocks |
|---|---|---|
| Principal Risk | None (if held to maturity) | High (subject to market volatility and corporate health) |
| Yield Certainty | Guaranteed by the US Government | Variable (subject to earnings and board approval) |
| Duration Risk | High (sensitive to further rate hikes) | Moderate to High (vulnerable to equity repricing) |
| Capital Appreciation | Limited to bond price fluctuations | Potential for long-term equity growth |
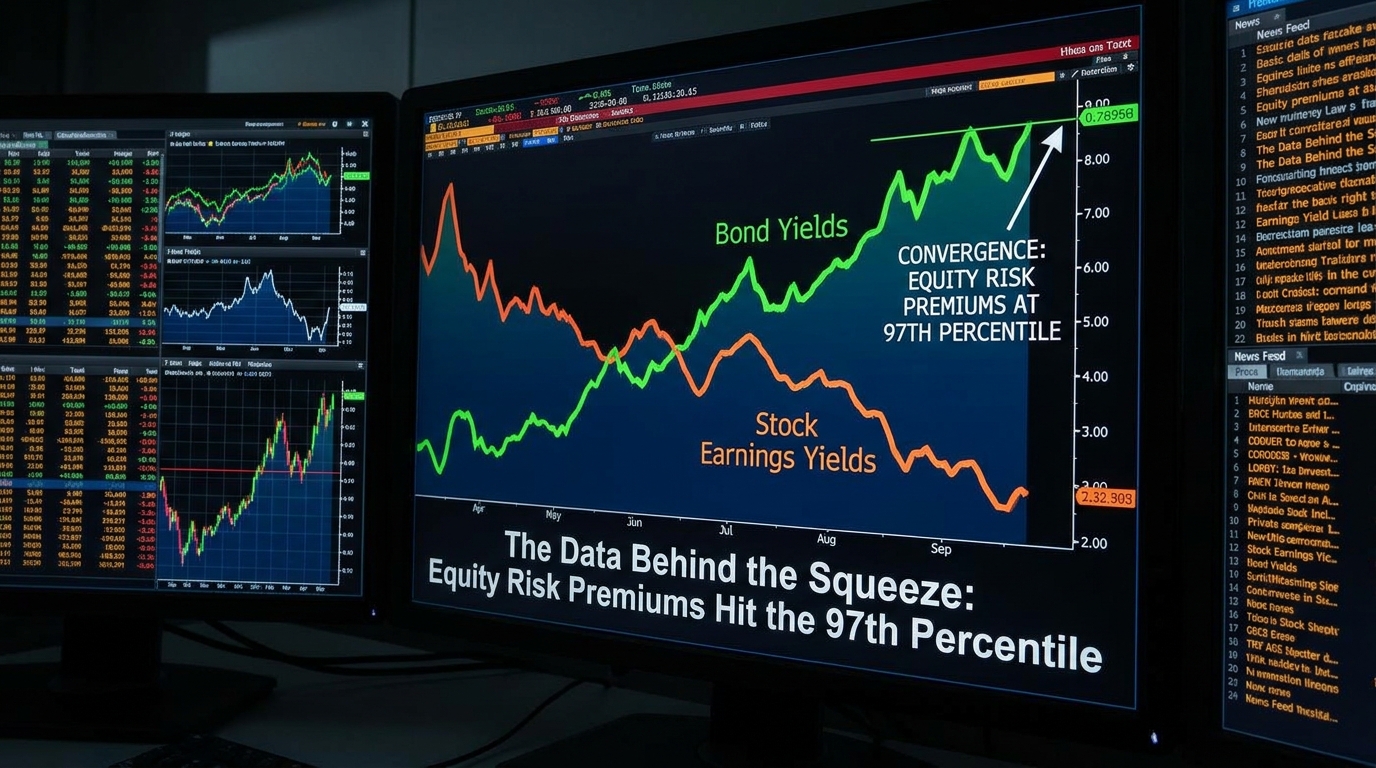
Highest-Signal Evidence: The Deterioration of the Equity Risk Premium
A notable data point emerging from this projected yield surge is the deterioration of the equity risk premium (ERP). The ERP measures the excess return investors demand for taking on the inherent volatility and principal risk of holding stocks over risk-free bonds. Trading data models suggest that the nominal equity risk premium for the S&P 500 could effectively vanish, slipping into negative territory as valuations stretch and yields rise concurrently, according to Reuters.
This inversion means the aggregate earnings yield of the S&P 500 would fall below the yield of the 10-year US Treasury note. This is a rare occurrence in modern market history, as noted by Ryan Lemand, PhD’s Post on LinkedIn. For US investors, this indicates that the traditional compensation demanded for bearing equity volatility over risk-free government debt has largely eroded.
Placing this squeeze into a broader historical context highlights the extent of the valuation shift. Looking at data spanning from the 1950s through a 2026 projection period, the inflation-adjusted US Equity Risk Premium sits at just 2.5%, according to Ryan Lemand, PhD’s Post on LinkedIn. This figure places the premium in the 97th percentile of historical data over the past seven decades.
To understand the magnitude of this deviation, the long-term equity risk premium for the S&P 500 is typically modeled at approximately 5%, according to baseline metrics from NYU Stern’s Aswath Damodaran, cited in Ryan Lemand, PhD’s Post on LinkedIn. By accepting roughly half the historical average compensation for inflation-adjusted equity risk, market participants may be implicitly betting on an extended period of strong macroeconomic execution.
This historically thin margin of safety is further pressured by shifting expectations surrounding Federal Reserve policy. The odds of the Federal Reserve hiking rates by at least 25 basis points experienced a temporary spike to over 35% before settling at 29%, according to Business Insider. The presence of this pricing acts as a persistent headwind, indicating that investors are hedging against potential central bank tightening.
Scenarios: Navigating the Valuation Paradigm

The exact trajectory of this asset rotation depends on how corporate earnings and Federal Reserve policy evolve in the face of restrictive yields. Market participants face three distinct scenarios:
The Base Case: A Gradual Rotation The base case scenario involves a steady rotation from equities into high-quality fixed income. Institutional investors, noting the inverted equity risk premium, may systematically secure elevated yields at the expense of broader equity exposure. Capital flows could reverse if macroeconomic data softens, but until an economic contraction materializes, passive index investors might experience periods of stagnation as the broader market digests this valuation headwind.
The Downside Scenario: Rising Yields and a Tech Sell-Off A downside scenario emerges if long-term yields rise well beyond the 5% level, driven by persistent inflation that prompts the Fed to act on its 29% probability of a rate hike. Because technology stocks are essentially long-duration assets, a higher discount rate would likely compress their multiples. If the 30-year yield continues its upward trajectory, the resulting valuation adjustment could outweigh fundamental strength in the sector, potentially triggering drawdowns for growth-heavy portfolios.
The Upside Scenario: Earnings Outpace the Discount Rate The upside scenario relies on corporate fundamentals proving resilient enough to outpace the headwinds generated by higher discount rates. Enterprise tech spending and artificial intelligence developments must deliver cash flows that exceed the market’s heightened cost of capital. If fundamental outperformance can neutralize the negative equity risk premium, equity multiples might hold steady despite elevated bond yields.
Navigating these divergent paths often involves a barbell strategy: securing elevated risk-free returns on one end to defend against multiple compression, while selectively participating in high-margin equity growth on the other.
What to Watch Next: Key Indicators for Asset Allocation

To navigate this environment, investors can monitor specific indicators that may influence the next phase of market pricing:
- The 5% Threshold as a Structural Floor: Observe whether the 5% mark acts as temporary resistance or becomes a new structural floor for the bond market. If yields anchor above 5%, it implies fixed-income markets are pricing in persistent inflation, potentially shifting corporate valuation discount rates upward.
- Federal Funds Futures: Shifting probabilities in the futures market serve as a leading indicator. Track whether the depressed 8% probability of a 2026 rate cut revives, or if the 29% probability of a rate hike continues to climb.
- Upcoming Inflation Prints: Consumer and producer price indices will act as immediate indicators determining Federal Reserve policy. Upside surprises may consolidate yields above 5%, while a sequence of cooling prints could ease valuation pressures.
- Tech Capex and Corporate Bond Issuance: Tech firms currently engaged in significant capital expenditures face a higher cost of capital. Monitor upcoming tech earnings reports for capital expenditure revisions or increased bond issuance volumes, which can serve as early indicators of financial friction.
- Equity Risk Premium Normalization: Watch for the ERP to normalize. Until this premium returns to historical averageseither through corporate earnings acceleration or a correction in stock pricesmarket upside may remain constrained.
Conclusion
The macroeconomic environment is showing signs of a shift, emphasizing the importance of the cost of capital. The projected return of the 30-Year Treasury 5% yield is more than a technical milestone; it is a factor that can compress equity multiples and challenge the traditional 60/40 portfolio allocation. With the equity risk premium shrinking into negative territory and the inflation-adjusted premium sitting at the 97th percentile of historical data, investors are currently modeled to receive historically low compensation for assuming stock market volatility. For allocators, the analytical takeaway suggests that defensive positioning may be prudent. Until corporate earnings accelerate or stock prices adjust to restore a wider margin of safety, the returns of the fixed-income market will likely continue to influence the ceiling for equity growth.
Disclaimer: This analysis is for informational purposes only and does not constitute investment, financial, real estate, or legal advice. Always consult a licensed financial advisor before making investment decisions.
FAQ
Why does the 30-year Treasury yield reaching 5% affect tech stocks more than other sectors? Technology and growth companies are considered “long-duration” assets because their valuations rely heavily on cash flows expected many years in the future. When the risk-free yield rises to 5%, the discount rate applied to those distant earnings increases, shrinking their present value and prompting a re-evaluation of premium stock multiples.
What is the Equity Risk Premium (ERP) and why is it notable? The Equity Risk Premium measures the excess return investors demand for taking on volatile stocks over risk-free government bonds. In this scenario, the ERP for the S&P 500 shrinks into negative territory, meaning the aggregate earnings yield of the stock market is lower than the yield on Treasury notes. This indicates investors may be taking on stock market risk with reduced mathematical compensation.
Do investors rotate out of dividend stocks when long-term Treasury yields hit 5%? Higher Treasury yields often prompt a repricing of traditional dividend-paying stocks, such as utilities and REITs. When investors can secure a 5% return from a sovereign-backed bond without taking on market volatility, the comparative risk/reward profile can shift capital out of dividend-heavy equities and into fixed income.
How do shifting Federal Reserve rate cut expectations impact long-term bond yields? Long-term bond yields typically move inversely to rate cut hopes. In the projected scenario, market probabilities for a 2026 Fed rate cut dropped from 20% to 8%, while the odds of a rate hike increased to 29%. The expectation that the Fed may keep rates higher for longer causes investors to demand higher yields on long-term bonds, pushing the 30-year Treasury yield toward the 5% threshold.