
10-Year Treasury Yield 5%: Impact on Stock Valuations
Higher benchmark yields and equity valuations: assessing the impact of tightening financial conditions
How rising sovereign yields affect equity valuations
When benchmark sovereign yields face upward pressure, equity valuations typically experience mathematical headwinds because risk-free rates form the baseline discount rate applied to future corporate cash flows. If risk-free yields rise and equity prices do not adjust downward, or if corporate earnings do not accelerate by an equal margin, the equity risk premium (ERP) compresses. According to ryanoconnellfinance.com, the ERP represents the expected excess return demanded by investors over risk-free government bonds ($ERP = E(R_M) - R_f$). A shift of just one percentage point in the ERP assumption can alter a company’s implied valuation by 20% to 30% ryanoconnellfinance.com.
Currently, sustained macroeconomic resilience is testing market assumptions. While standard financial models indicate that higher risk-free rates narrow the return spread between stocks and bonds, whether this compression leads to a severe equity de-rating depends on whether corporate earnings growth, supported by large capital investment cycles, can expand fast enough to offset elevated discount rates.
Macroeconomic catalysts: labor resilience and global price pressures
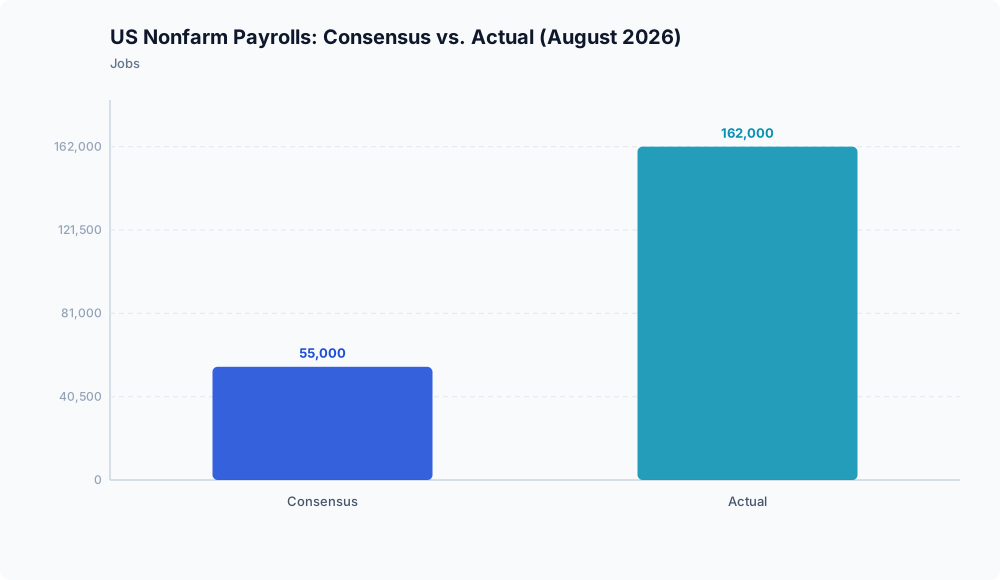
Upward momentum in sovereign bond yields has been driven primarily by an unexpectedly durable US economy, prompting a reassessment of near-term Federal Reserve policy. According to UBS, US nonfarm payrolls grew by 162,000 in August 2026, significantly surpassing the consensus estimate of 55,000. This employment surprise showed that domestic hiring remains strong, dampening expectations that the economy will cool quickly enough to subdue underlying inflation.
In response to this labor market strength, UBS revised its monetary policy baseline, projecting that the Federal Reserve will implement 25-basis-point interest rate hikes in both September and December 2026.
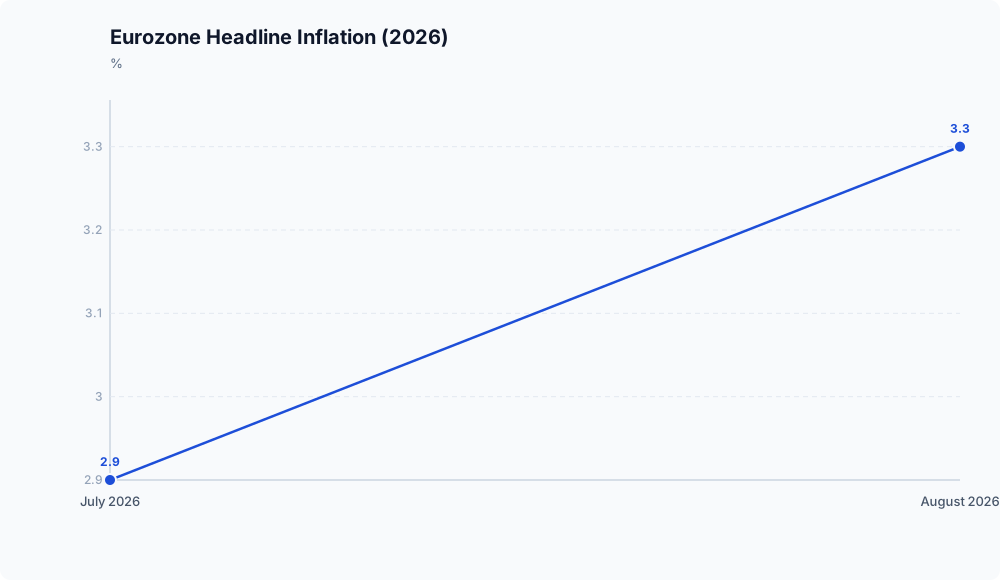
These domestic pressures are mirrored internationally. In the Eurozone, headline inflation accelerated from 2.9% in July to 3.3% in August 2026, driven largely by elevated energy costs, according to UBS. Persistent global price pressures reduce the likelihood of coordinated interest rate cuts across major central banks, adding upward pressure to global term premia and sovereign debt yields worldwide.
The valuation transmission mechanism and equity risk premia
The standard financial transmission mechanism between risk-free benchmark rates and equity markets relies on the spread between the equity earnings yield (earnings per share divided by price) and prevailing sovereign debt yields. When policy expectations and government bond yields rise:
- Cash flows projected far into the future, such as those of high-growth technology companies, are discounted at higher rates, reducing their present value.
- If equity prices remain elevated while risk-free yields rise, the excess return demanded by investors for bearing equity market risk diminishes unless earnings expand proportionally.
Historical market records show that when the US 10-year Treasury yield surged past 5%—hitting its highest level since 2007 on elevated expectations of Federal Reserve rate hikes—the S&P 500 tested the 4200 level, according to Investing.com. While available data do not provide specific aggregate price-to-earnings multiples during that session, standard asset-pricing principles dictate that higher benchmark yields erode the equity risk premium absent a concurrent surge in corporate earnings.
The corporate capex counterweight
A major variable tempering the valuation drag of higher discount rates is private sector capital spending. Global artificial intelligence capital expenditure is projected to reach approximately USD 900 billion in 2026 and USD 1.2 trillion in 2027, according to forecasts from UBS.
This scale of enterprise expenditure serves two distinct roles:
- Substantial capital outlays support broader economic activity, reinforcing the growth that keeps central bank policy restrictive.
- For companies exposed to structural infrastructure and technology cycles, real earnings expansion generated by these investments could offset discount rate headwinds.
For portfolio allocators, this dynamic creates a divided outlook. Higher policy rates enhance the return profile of cash and fixed-income assets without requiring equity risk. Yet whether elevated growth multiples are sustainable hinges on whether capital spending translates into realized corporate cash flows, or whether higher hurdle rates ultimately drive capital rebalancing toward debt instruments.
Key takeaways for market participants

Persistent labor demand and energy-driven global inflation prints have shifted policy forecasts toward further tightening rather than easing. For investors, this requires distinguishing between macroeconomic indicators and asset-pricing theory:
- Institutional projections from UBS of two 25-basis-point Federal Reserve rate increases in 2026 reflect evolving market forecasts rather than formal policy commitments.
- While higher benchmark yields theoretically compress the equity risk premium, empirical confirmation of multiple de-rating depends on upcoming corporate earnings prints and realized revenue from enterprise capex.
- Investors should balance the yields available in risk-free instruments against the growth potential offered by major capital investment cycles.
Disclaimer: This analysis is for informational purposes only and does not constitute investment, financial, real estate, or legal advice. Always consult a licensed financial advisor before making investment decisions.
Frequently asked questions

How does a bear-steepening yield curve impact equity valuations differently than a bear-flattening curve?
Under standard financial theory, a bear-flattening curve, driven by short-term rates rising faster than long-term rates, typically reflects aggressive central bank tightening that restricts liquidity and near-term economic growth. Conversely, a bear-steepening curve, where long-term yields surge faster than short-term rates, places direct pressure on the long-duration discount rates used in equity asset-pricing models. This compresses multiples for high-growth sectors even if near-term policy expectations remain stable. However, observed data on specific curve spreads are not documented in the provided figures.
Which equity sectors are historically most sensitive to a sustained 10-year yield above 5.00%?
From an asset-pricing perspective, sectors with long-duration cash flows, such as high-growth technology and speculative enterprise software, are theoretically the most vulnerable to multiple compression when discount rates rise. In contrast, sectors that benefit from infrastructure spending, such as technology hardware supported by the projected USD 1.2 trillion in 2027 AI capex reported by UBS, may see operational earnings growth offset higher hurdle rates. Specific historical performance metrics for sectors at a 5% benchmark yield are not provided in the current dataset.