
Treasury Yield Spike: Impact on Stocks and Fed Rate Cuts
Treasury yield trajectory: What resilient labor data means for rates and valuations
Unexpectedly resilient labor data has driven benchmark borrowing costs sharply higher, upending expectations for steady Federal Reserve easing. While initial forecasts assumed yields would remain contained, hiring strength has pushed bond yields upward, forcing markets to reassess discount rates, corporate valuations, and the likelihood of future rate cuts.
Policy accommodation meets resilient hiring
In December 2025, the Federal Reserve reduced its benchmark policy rate to a range of 3.5% to 3.75% in response to cooling labor demand, reinforcing expectations of an ongoing easing cycle (AInvest). Under that outlook, early baseline fixed-income projections anticipated the 10-year Treasury yield would remain rangebound between 3.75% and 4.25% throughout 2026 (AInvest).
Persistent employment gains quickly challenged those assumptions. U.S. employers added 130,000 payroll jobs in January 2026, exceeding economists’ forecasts (Los Angeles Times). Following that release, the 10-year Treasury yield edged up from 4.16% late Tuesday to 4.17%, while the S&P 500 dipped 0.34 points to close at 6,941.47 (Los Angeles Times).
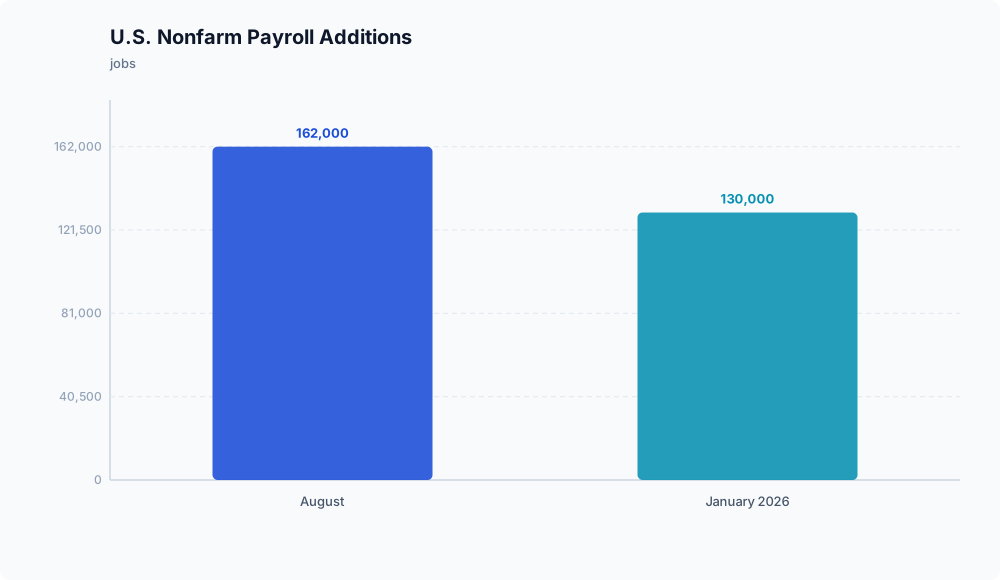
Hiring momentum strengthened further later in the year. The U.S. economy added 162,000 jobs in August 2026, while the unemployment rate held unchanged at 4.1% (listwithtina.com). Rather than staying confined to the earlier 3.75% to 4.25% band, the benchmark 10-year Treasury yield approached 4.8% in early September 2026 as traders dramatically increased bets that the Fed could hike interest rates rather than cut them (listwithtina.com).
Valuation models vs. empirical market impact
In corporate valuation, the 10-year Treasury yield serves as the primary risk-free benchmark when calculating discount rates. The equity risk premium (ERP) measures expected market returns above this risk-free rate, calculated as $ERP = E(R_M) - R_f$ (ryanoconnellfinance.com). A one-percentage-point change in the ERP can alter a firm’s implied equity valuation by 20% to 30% (ryanoconnellfinance.com). When risk-free yields spike without a concurrent rise in earnings projections, hurdle rates climb and equity multiples face theoretical compression.
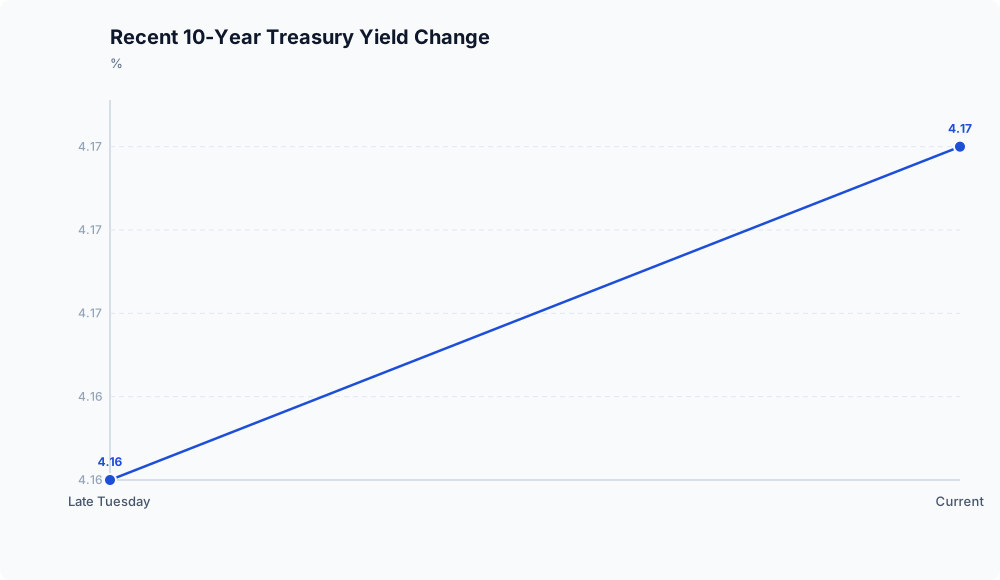
Realized equity movements, however, have shown measured pullbacks rather than a severe collapse. Following January’s employment data, the S&P 500 fell by only 0.34 points as yields settled at 4.17% (Los Angeles Times). Later, when yields approached 4.8% following the August report, the S&P 500 slipped 0.38%, the Dow Jones Industrial Average dropped approximately 0.51%, and the Nasdaq fell 0.29% (listwithtina.com). Because broader sector-level cost-of-capital datasets are not detailed in verified reports, systemic multiple impairment across all industries remains unconfirmed.
Lending conditions and balance-sheet realities
The run-up in Treasury yields has direct implications for credit markets and fixed-rate assets. Earlier in the year, yields hovering near 4.17% against a 3.5% to 3.75% policy rate reflected a relatively flat curve (AInvest; Los Angeles Times). By September, the surge toward 4.8% pushed Freddie Mac average 30-year fixed mortgage rates to 6.71% as of September 3, with daily lender surveys reaching between 6.8% and 7.0% (listwithtina.com).
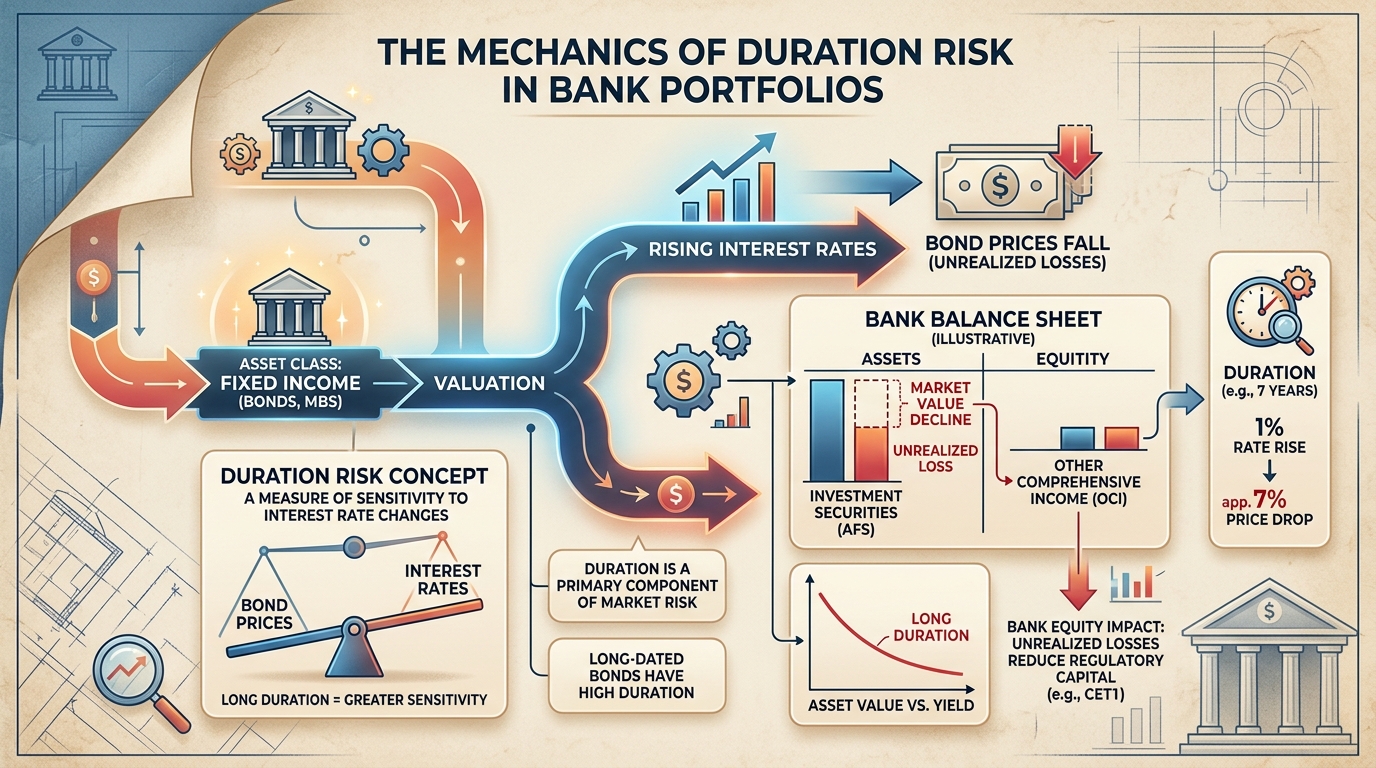
These elevated borrowing costs restrict mortgage affordability and consumer purchasing power (listwithtina.com). However, specific banking sector metrics—such as aggregate unrealized mark-to-market portfolio losses or net interest margin compression—are not recorded in the available evidence.
Market takeaways

The narrative for 2026 has diverged significantly from early expectations of continuous central bank accommodation. Although baseline projections anticipated yields remaining within a 3.75% to 4.25% channel (AInvest), persistent job creation pushed the 10-year yield toward 4.8% by early September (listwithtina.com).
With strong hiring reducing the urgency for easing and raising the risk of further policy tightening, investors face an environment where financing costs remain higher for longer. While major stock indexes have demonstrated resilience near record levels, sustained upward pressure on yields continues to elevate capital costs across credit and equity markets.
Disclaimer: This analysis is for informational purposes only and does not constitute investment, financial, real estate, or legal advice. Always consult a licensed financial advisor before making investment decisions.
Frequently asked questions
How does an increase in the 10-year Treasury yield directly lower the Equity Risk Premium (ERP)? The equity risk premium represents the expected excess return demanded by investors for holding equities over a risk-free benchmark, expressed as $ERP = E(R_M) - R_f$ (ryanoconnellfinance.com). Because the 10-year Treasury yield serves as the standard risk-free rate ($R_f$) in valuation models, an increase in benchmark yields mechanically narrows the gap between stock earnings yields and bond returns unless expected corporate earnings expand at the same pace. When share prices remain resilient alongside climbing yields, the implied compensation investors receive for bearing equity risk narrows.