
10-Year Treasury Yield at 5%: Commercial Cap Rates & Mortgages
How Elevated Benchmark Yields Reshape Real Estate Valuations
How do higher benchmark yields alter property markets across commercial and residential sectors?
When baseline risk-free rates rise—such as the 10-year Treasury yield finishing just above 5% as reported by Enterprise Bank & Trust—property yields must expand to restore a viable risk premium over government debt. In commercial real estate, this mechanically exerts downward pressure on property prices to prevent negative leverage, where borrowing costs exceed property yields. In residential real estate, elevated capital costs restrict buyer purchasing power, creating friction between seller asking prices and completed transaction values.
While the theoretical mechanics for commercial assets follow standard financial principles, empirical confirmation varies by sector. Available transaction-level data demonstrates price stagnation and widening listing-to-sale discounts in residential housing, whereas sector-wide commercial yield adjustments and maturity volumes remain unmeasured in the validated record.
Commercial Cap Rates and the Mechanics of Negative Leverage
The 10-year Treasury yield serves as the fundamental risk-free benchmark against which commercial real estate investments are measured. In institutional real estate valuation, an asset’s capitalization rate—the ratio of its net operating income (NOI) to its acquisition price—must clear this baseline while providing an adequate risk spread. This spread compensates investors for illiquidity, lease renewal uncertainty, operational overhead, and ongoing capital expenditures.
When the risk-free rate resets near 5.0%—with the 10-year Treasury yield closing just above 5% for two consecutive days according to Enterprise Bank & Trust—commercial assets that previously traded at cap rates near or below that threshold lose their historical risk buffer. Because capital requires an excess return over sovereign debt, property prices must adjust downward to elevate cap rates back to a viable spread.
Cap Rate Compression vs. Expansion:
High Benchmark Yield (5%) + Risk Premium = Target Cap Rate (>5%)
If Property Cap Rate < Cost of Debt  ===> Negative Leverage (Equity Yield Diluted)
This valuation reset is reinforced by negative leverage. In commercial acquisitions, debt is typically deployed to enhance equity returns. However, if the all-in cost of debt rises above an asset’s capitalization rate, debt service absorbs an unsustainable portion of net operating income. Under these conditions, borrowing additional capital dilutes the cash-on-cash equity yield rather than boosting it. To prevent equity from subsidizing debt, prospective buyers must reduce their acquisition bids until property yields rise above prevailing borrowing rates.
Empirical Evidence: Residential Pricing and Valuation Friction
While institutional valuation models dictate that commercial yields must adjust, verified transaction data within the current record is restricted to localized residential metrics. Analytically, residential dynamics cannot substitute for commercial trends: residential pricing reflects local supply and owner-occupant affordability, whereas commercial values depend strictly on capitalized net operating income and institutional debt terms.
Nevertheless, residential metrics illustrate how elevated financing costs introduce transactional friction and widen the spread between buyers and sellers. In Thousand Oaks, California, recent data demonstrates price stagnation and discounting:
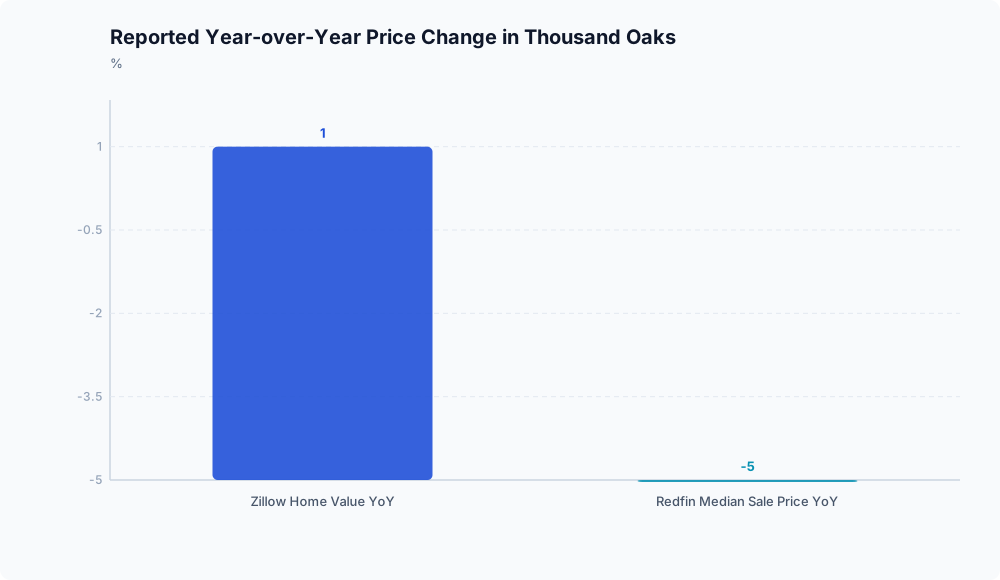
- Broad Asset Values: According to Nicki & Karen, Zillow reported a typical home value of $1,047,273 as of July 31, 2026, marking a flat 1.0% increase year-over-year.
- Closed Transactions: For the three months ending July 2026, Redfin recorded a median sale price near $1.1 million, reflecting a 5.0% year-over-year contraction as reported by Nicki & Karen.
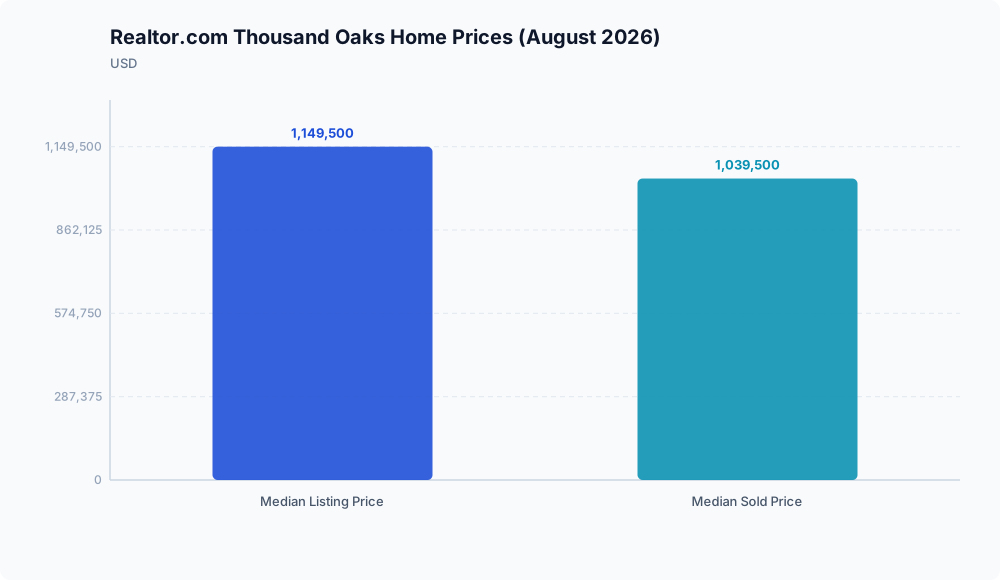
- The Bid-Ask Spread: In August 2026, Realtor.com documented a median listing price of $1,149,500 against a median sold price of $1,039,500, according to Nicki & Karen.
This $110,000 gap between asking and closing prices illustrates active resistance among buyers. While listing prices frequently anchor to prior cyclical peaks, closed transactions indicate that market clearing requires downward concessions or a shift toward lower-priced inventory.
Data Boundaries and Analytical Takeaways
The observed market deceleration reflects transactional caution, yet analytical distinctions must be maintained between verified data and editorial synthesis:
| Metric / Domain | Status in Record | Observed / Theoretical Behavior |
|---|---|---|
| Commercial Cap Rates | Theoretical Model | Valuations face mechanical pressure to adjust above benchmark debt rates. |
| Commercial Debt Spreads | Unverified in Record | Empirical magnitude, velocity, and default volumes remain unknown. |
| Residential Value Trend | Empirical (Thousand Oaks) | Flat annual baseline (+1.0% via Zillow as of July 31, 2026). |
| Residential Transaction Trend | Empirical (Thousand Oaks) | Realized sales softening (-5.0% YoY via Redfin for 3 months ending July 2026). |
| Bid-Ask Pricing Spread | Empirical (Thousand Oaks) | $110,000 listing-to-sale gap in August 2026 via Realtor.com. |
The verified record does not track loan origination rates, mortgage terms, or commercial debt expirations. Consequently, linking benchmark yields directly to localized housing softening represents an editorial interpretation based on observed transaction behavior rather than explicit mortgage-origination datasets.
Conclusion

Elevated baseline yields fundamentally alter real estate underwriting. In the commercial sector, sustained high benchmark rates mechanically restrict values: without aggressive net operating income growth, transaction prices must decline to restore risk premiums and eliminate negative leverage.
In the residential sector, empirical findings reveal how financing constraints manifest on the ground—stalling asset appreciation, discounting completed sales, and driving an active wedge between seller expectations and buyer capacity. For investors and buyers alike, these dynamics demand disciplined underwriting anchored to current financing realities rather than legacy pricing peaks.
Disclaimer: This analysis is for informational purposes only and does not constitute investment, financial, real estate, or legal advice. Always consult a licensed financial advisor before making investment decisions.
Frequently Asked Questions
Why does a 5% Treasury yield trigger negative leverage in commercial real estate?
Negative leverage occurs when the all-in cost of borrowed debt exceeds an acquisition’s capitalization rate. Because commercial borrowing costs include a spread over the risk-free benchmark, a 10-year Treasury yield finishing just above 5%—as documented by Enterprise Bank & Trust—pushes debt financing costs higher. If an asset’s cap rate is lower than the loan’s interest rate, debt service consumes a disproportionate share of net operating income, actively reducing equity yields unless purchase prices adjust downward to expand cap rates.
How does an elevated mortgage environment create contradictory signals between listing prices and closed sales?
In an elevated borrowing cost environment, seller asking prices tend to lag market conditions, remaining anchored to prior peak valuations. Conversely, buyers facing constrained borrowing capacity negotiate discounts or purchase lower-priced tiers. This creates diverging indicators, evidenced by Realtor.com data for August 2026 in Thousand Oaks showing a median listing price of $1,149,500 alongside a median sold price of $1,039,500, as reported by Nicki & Karen.