
How a 5% 10-Year Treasury Yield Impacts Stock Valuations
How a 10-year U.S. Treasury yield reaching 5% reshapes equity valuations and capital allocation
When the benchmark 10-year Treasury yield reaches 5%, the equity risk premium (ERP) falls toward zero, raising the return threshold for risk assets and compressing valuation multiples across equities. Because risk-free sovereign debt yields roughly the same as corporate earnings, institutional allocators often shift capital toward fixed income, leaving stock prices dependent on corporate profit growth to justify valuations.
Macro tightening lifts baseline borrowing costs
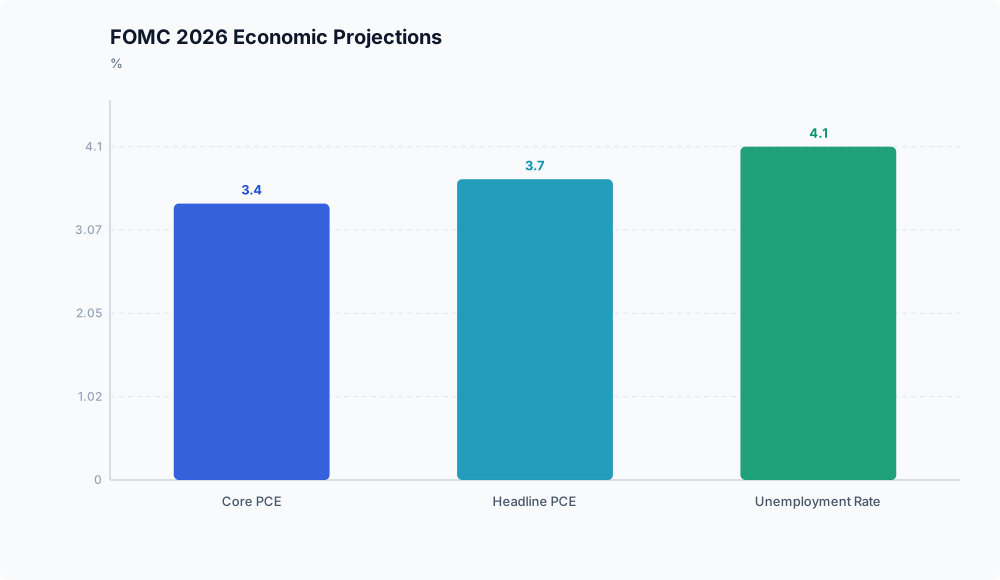
Yields rose following prolonged monetary restraint by the Federal Reserve. In September 2026, the Federal Open Market Committee (FOMC) voted 12-0 to raise the benchmark federal funds rate by 25 basis points to a target range of 3.75% to 4.0%, as reported by CNBC. Fed officials also upgraded their 2026 projections for headline personal consumption expenditures (PCE) inflation to 3.7% and core PCE to 3.4%, while trimming expected unemployment to 4.1% (CNBC).
Consumer lending rates rose alongside policy rates. The 30-year fixed-rate mortgage reached 7.19%, an increase of roughly 38 basis points following the Jackson Hole symposium, according to Mortgage News Daily data cited by CNBC.
The 10-year U.S. Treasury yield subsequently closed above 5% on two consecutive trading days in September 2026, as documented by Enterprise Bank & Trust. Because market-based, long-term inflation expectations remained anchored at 2.3% (Enterprise Bank & Trust), the increase reflected higher real borrowing costs rather than higher long-term inflation expectations.
The equity risk premium and multiple de-rating
Higher Treasury yields have altered the spread between equities and government bonds. The equity risk premium (ERP), measured by the earnings yield gap (the S&P 500 earnings yield minus the 10-year Treasury yield), reflects the excess return investors demand for holding equities over risk-free debt.
Compression in this spread appeared earlier in the year. As of June 30, 2026, the trailing S&P 500 earnings yield was 4.11% (based on an index price of $7,499 against $307.86 in earnings), while the 10-year Treasury yielded 4.38%, according to Current Market Valuation. This placed the earnings yield gap at -0.27%, which is 0.25 standard deviations below its historical average spread of +0.25%.
Historical Average Spread:       +0.25%
June 30, 2026 Spread:            -0.27% (4.11% S&P Yield - 4.38% 10-Yr Treasury)
September 2026 Forward Spread:   +0.26% (5.26% Implied Yield - 5.00% 10-Yr Treasury)
As the 10-year Treasury crossed 5%, equity valuation multiples adjusted downward. The forward price-to-earnings (P/E) multiple for the S&P 500 compressed from 22x at the start of 2026 to 19x, according to Goldman Sachs.
A 19x forward multiple implies a forward earnings yield of approximately 5.26% ($1 / 19$). Against a 5% risk-free Treasury yield, the spread narrows to roughly 26 basis points. This narrow spread leaves little yield premium for holding corporate equities over default-free government debt.
Capital rotation and valuation hurdles for growth
Yield parity changes institutional portfolio construction. For asset allocators with fixed return hurdles or liability targets, a 5% sovereign yield offers a predictable way to meet targets without taking on equity market risk.
Within equities, higher discount rates affect sectors unevenly:
- Growth companies that derive most of their valuation from cash flows expected far in the future experience larger valuation drops, as compounding discounts distant cash flows more heavily when rates rise.
- Mature companies with near-term cash distributions face less discounting pressure, though they still compete directly with a 5% risk-free return.
Multiple compression occurred even as consensus estimates projected full-year 2026 S&P 500 earnings growth to surpass 30%, as observed by Enterprise Bank & Trust. Higher discount rates can offset strong underlying earnings growth. With market multiples around 19x forward earnings, operational shortfalls relative to profit expectations increase the risk of further valuation reductions.
Market implications

A 5% 10-year Treasury yield establishes a high baseline return for competing assets. When sovereign debt offers yields comparable to corporate earnings yields, equity gains rely on earnings growth rather than multiple expansion. If corporate profits fail to meet growth targets, equity holdings carry market volatility without providing the historical risk premium that typically accompanies it.
Disclaimer: This analysis is for informational purposes only and does not constitute investment, financial, real estate, or legal advice. Always consult a licensed financial advisor before making investment decisions.
Frequently asked questions

What S&P 500 earnings yield or multiple is required to restore an average historical equity risk premium?
According to historical data from Current Market Valuation, the long-term average earnings yield gap is +0.25% above the 10-year Treasury yield. With Treasury yields at 5.00%, the S&P 500 requires an earnings yield of at least 5.25% to restore this historical average spread. In valuation terms, this equates to a price-to-earnings (P/E) multiple of approximately 19x ($1 / 0.0526 \approx 19.0$).
Why are long-duration equities more sensitive to higher 10-year Treasury yields than cyclical or value stocks?
Long-duration equities derive most of their value from cash flows projected years or decades ahead. In discounted cash flow models, higher 10-year yields raise the baseline discount rate. Because discounting compounds over time, cash flows scheduled further out face larger reductions in present value than cash flows generated in the near term by value or cyclical companies.