
Analyzing FOMC Rate Hike Real Estate Transmission Risks
How the September 2026 Fed Rate Hike Pressures Commercial Real Estate
How does the Federal Reserve’s September 2026 policy tightening transmit risk into commercial property markets?
By lifting baseline financing costs, the policy action directly compresses debt service coverage for an estimated $875 billion to $936 billion in commercial and multifamily debt maturing in 2026 (Investing In CRE). Because the central bank signaled that core inflation will stay elevated through 2026 (J.P. Morgan Asset Management), commercial property owners face a prolonged window of higher borrowing costs rather than near-term rate relief.
The Policy Shift: Persistent Inflation and a Firm Borrowing Floor
At its September 2026 meeting, the Federal Open Market Committee (FOMC) unanimously voted to lift the federal funds rate target range by 25 basis points to 3.75%–4.00% (J.P. Morgan Asset Management). The adjustment reflects continuing central bank efforts to return inflation to its longer-run objective.
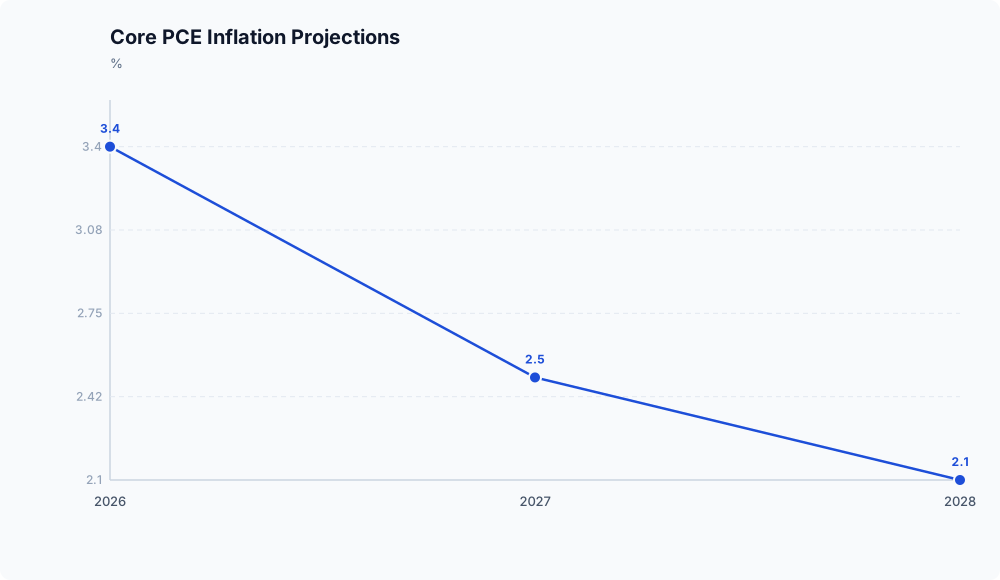
The primary catalyst for the hike appeared in the Committee’s updated Summary of Economic Projections (SEP). Policymakers revised their 2026 Core Personal Consumption Expenditures (PCE) inflation forecast upward by 0.1% to 3.4%, while maintaining their projections of 2.5% in 2027 and 2.1% in 2028 (J.P. Morgan Asset Management).
Because core PCE is projected to remain well above the 2.0% target through 2026, the FOMC signaled that monetary policy must remain restrictive (J.P. Morgan Asset Management). Maintaining elevated benchmark rates dampens expectations for rapid borrowing cost reductions across debt markets.
Commercial Real Estate: DSCR Compression and the 2026 Maturity Wall
The transmission of this benchmark policy into commercial properties occurs via higher marginal borrowing costs across debt facilities. Commercial real estate faces an immense refinancing schedule, with $875 billion to $936 billion in commercial and multifamily debt maturing in 2026 alone (Investing In CRE). Broader estimates track total 2026 maturities reaching $1.5 trillion to $1.8 trillion (MMG Real Estate Advisors; Apers).
Underwriting new debt against this maturity wave requires properties to service far higher interest charges than when their original loans were placed. Many maturing loans were originated at interest rates between 3% and 4%, whereas refinancing terms often sit near 6% to 7% or higher (Investing In CRE).
Higher marginal borrowing costs reduce a property’s debt service coverage ratio (DSCR)—the ratio of net operating income (NOI) to annual debt obligations:
- When interest rates climb, debt service requirements expand.
- Properties that have not grown NOI at a pace sufficient to match these higher payments fall below minimum lender coverage thresholds.
- A failure to meet required DSCR levels prevents lenders from issuing full replacement loans, producing a refinancing gap.
Sector Pressures: Multifamily and the Refinancing Gap

Refinancing pressures extend across commercial sectors, with multifamily facing a steep maturity curve. Multifamily loan maturities climb 56% from roughly $104.1 billion in 2025 to $162.1 billion in 2026, before rising to $167.7 billion in 2027 (MMG Real Estate Advisors). In Q3 2025, total distressed commercial real estate volume hit $126.6 billion, with multifamily assets accounting for $22.8 billion, or 18% (MMG Real Estate Advisors).
The core issue confronting sponsors is the refinancing gap—the shortfall between existing loan balances and the takeout proceeds a new lender will approve under tighter debt yield and DSCR limits (Apers). With the 10-year Treasury near 4.40% in mid-2026, agency multifamily coupons range from 5.50% to 6.00%, while commercial bank loans sit between 6.50% and 7.00% (Apers).
Performance stress varies by property sector. Trepp data for Q1 2026 shows CMBS delinquency rates of 10%–12% for office properties, over 6% for multifamily as of 2025, mid-single digits for retail, and below 1% for industrial (Apers). While essential-service assets like medical office and grocery retail benefit from steadier fundamentals (Investing In CRE), levered properties facing valuation drops must secure equity injections, execute loan modifications, or face distressed sales (MMG Real Estate Advisors).
Analytical Takeaways
The Fed’s September 2026 rate hike and updated projections confirm that elevated capital costs will remain in place through 2026 (J.P. Morgan Asset Management). For commercial property stakeholders, the operational conclusions are clear:
- Refinancing hurdles will peak in 2026–2027. With $875 billion to $936 billion maturing in 2026 (Investing In CRE) and broader estimates tracking up to $1.8 trillion (MMG Real Estate Advisors), assets facing coupon resets from 3%–4% to 6%–7% or higher face compressed takeout proceeds.
- Capital stacks require fresh equity. Borrowers unable to satisfy conservative debt yield or DSCR sizing constraints must supply gap equity, introduce preferred equity or mezzanine debt, or negotiate extensions (Apers; MMG Real Estate Advisors).
- Distress remains sector-specific. Higher delinquency in office and select multifamily portfolios contrasts with stronger stability in industrial and medical retail assets (Apers; Investing In CRE).
Until core PCE inflation declines toward the Fed’s 2.0% objective—not projected by the FOMC to reach 2.1% until 2028 (J.P. Morgan Asset Management)—borrowers cannot rely on monetary easing to bridge debt deficits.
Disclaimer: This analysis is for informational purposes only and does not constitute investment, financial, real estate, or legal advice. Always consult a licensed financial advisor before making investment decisions.