
How the FOMC Terminal Rate Reset Impacts Equity Valuations
How the FOMC rate reset reshapes equity valuations and capital costs
How does the Federal Reserve’s September 2026 policy tightening affect equity valuations and corporate balance sheets?
The Federal Reserve’s unanimous decision to raise the federal funds target range to 3.75% to 4.00%, coupled with an upward revision to projected core inflation, establishes a higher cost of capital for longer. For equity markets, this policy stance mechanically compresses valuation multiples on long-duration cash flows and widens the valuation divide between self-funding, profitable companies and capital-constrained operators.
The policy shift: higher inflation projections and policy realities
At its September 2026 meeting, the Federal Open Market Committee (FOMC) voted unanimously to raise the target range for the federal funds rate by 25 basis points to 3.75% to 4.00%, according to J.P. Morgan Asset Management. The consensus among Committee members showed broad agreement regarding the immediate need for incremental monetary tightening.
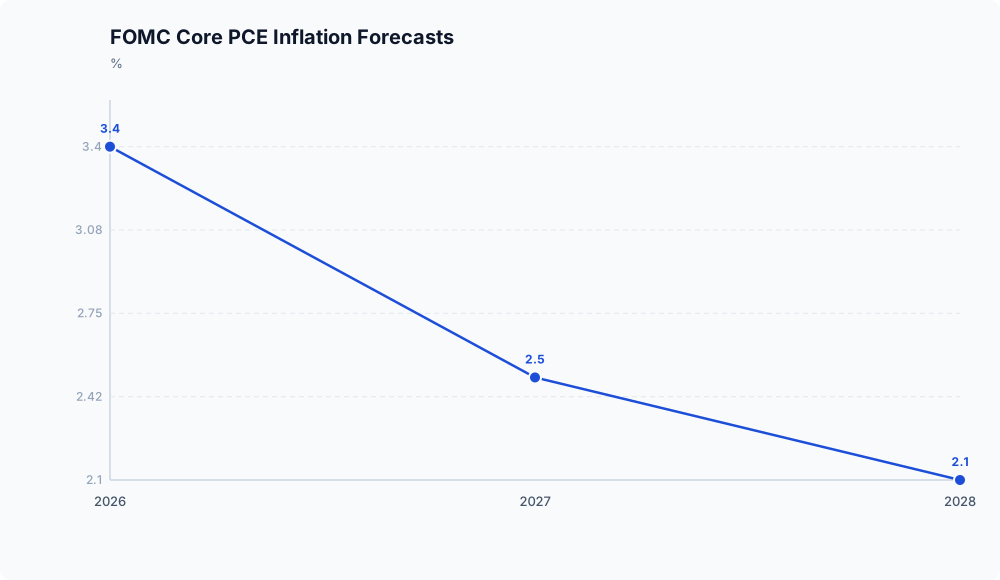
Alongside the rate hike, the Federal Reserve updated its Summary of Economic Projections to reflect persistent underlying price pressures. As reported by J.P. Morgan Asset Management, the FOMC increased its 2026 Core Personal Consumption Expenditures (PCE) inflation forecast by 0.1 percentage point to 3.4%, while holding projections unchanged at 2.5% for 2027 and 2.1% for 2028.
Because core PCE is projected to remain above the central bank’s 2.0% objective through at least 2028, the Committee faces structural constraints against near-term easing. While broader market scenarios evaluate an eventual terminal rate anchored at 4.1%, the documented record confirms an active policy band of 3.75% to 4.00%, and specific 4.1% terminal projections remain unverified. Even within the realized 3.75% to 4.00% band, the upward revision to inflation expectations signals that policy must remain restrictive until price growth demonstrably cools.
Valuation transmission: the discount rate mechanism
The persistence of an elevated policy rate directly resets the risk-free rate baseline used to establish institutional hurdle rates. In a standard discounted cash flow (DCF) framework, higher nominal yields increase the discount rate applied to future corporate earnings.
When baseline yields adjust toward the 4.00% ceiling, or a theoretical 4.1% terminal anchor, long-duration growth equities face disproportionate pressure. Because the intrinsic value of growth companies depends heavily on cash flows generated years into the future, higher discount rates penalize those distant earnings more severely. Unless accelerated earnings growth offsets this mathematical drag, elevated hurdle rates mechanically compress equity risk premiums and drive price-to-earnings de-ratings across growth-oriented sectors.
Corporate bifurcation: balance sheet quality vs. debt burdens

In a sustained higher-rate regime, operating cash flows create a sharp divide between self-sufficient businesses and those requiring external capital. According to NYU Stern data reported by InvestViable, profitable U.S. industrial firms traded at an enterprise value to EBITDA (EV/EBITDA) multiple of 21.58x in Q1 2026, whereas the multiple across all industrial firms rose to 33.42x.
This 11.84x disparity illustrates how non-earning or unprofitable businesses distort aggregate sector benchmarks upward. When funding costs rise, cyclical operators without reliable positive cash flows face operational strain to service their debt, while profitable cyclicals trade at more earnings-backed valuations.
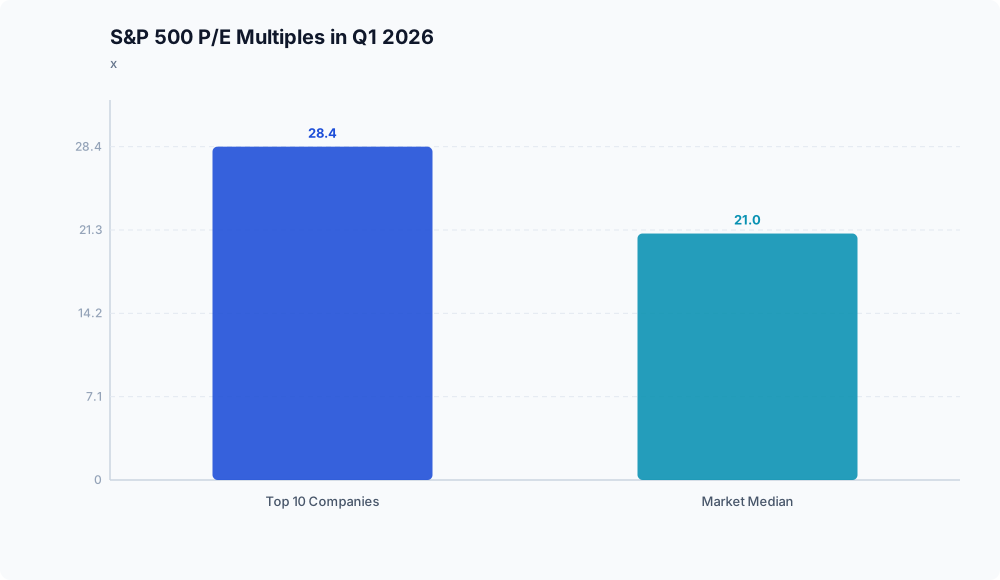
A parallel flight to financial strength is evident across the broader equity market. Based on J.P. Morgan data compiled by InvestViable, the top 10 S&P 500 companies traded at an average price-to-earnings (P/E) multiple of 28.4x in Q1 2026, compared to a market median multiple of 21.0x.
This 7.4x premium reflects institutional willingness to pay for market dominance, high liquidity, and strong balance sheets. However, aggregate sector multiples do not disclose company-specific debt profiles. The available data does not measure the exact operational strain caused by floating-rate exposure versus near-term debt maturities, leaving that assessment as an analytical deduction.
Analytical synthesis: what the evidence means

The September 2026 policy update indicates that expectations for an aggressive rate-cutting cycle are misaligned with central bank projections. With core PCE inflation forecast to remain above target through 2028, capital costs are set to remain higher for longer.
For market participants, this dynamic means that baseline interest rates constrain overall market multiple expansion. Under these conditions, fundamental cash generation and balance sheet resilience take precedence over speculative future growth, as the premium for self-funded operators rises relative to capital-dependent competitors.
Disclaimer: This analysis is for informational purposes only and does not constitute investment, financial, real estate, or legal advice. Always consult a licensed financial advisor before making investment decisions.