
AI Infrastructure Debt and Capex: Assessing Balance Sheets
AI infrastructure debt and capex: assessing balance sheets amid diverging inflation
How is surging infrastructure expenditure affecting corporate balance sheets amid divergent inflation signals?
Corporate America is deploying historic volumes of capital into facilities, equipment, and intellectual property, supported by near-record corporate debt issuance (IMTC). While cooling core inflation provides cost predictability for non-energy operations, elevated headline inflation keeps benchmark borrowing rates high (U.S. Department of the Treasury). Consequently, enterprises undertaking capital-intensive expansions face substantial debt-servicing liabilities and constrained cash conversion.
The capital buildout: scale and unit economics
Hyperscale operators are committing large sums of capital to expand physical computing networks. Projections from CBRE Research reported by AI Tool Discovery indicate that Amazon Web Services, Microsoft, Google, and Meta plan to deploy a combined $290 billion on new data center and IT infrastructure through 2027.
This expansion has driven ground-level activity. In 2025, U.S. data center construction starts reached $77.7 billion, representing a 190% increase year over year, according to ConstructConnect data cited by AI Tool Discovery.
Facility construction benchmarks clarify these rising capital outlays. Constructing a standard hyperscale facility in 2025 cost between $10 million and $12 million per megawatt of capacity, based on Construct Elements data reported by AI Tool Discovery.
Macroeconomic accounts reflect this investment momentum. According to the U.S. Department of the Treasury, U.S. business investment grew by over 10% in the first quarter of 2026, driven primarily by spending on new equipment and intellectual property.
+--------------------------------------------------------------------------+
| Hyperscaler Plans through 2027 (CBRE via AI Tool Discovery)              |
| AWS, Microsoft, Google, Meta: $290 Billion                               |
+--------------------------------------------------------------------------+
| 2025 Data Center Construction Starts (ConstructConnect)                  |
| $77.7 Billion (+190% YoY)                                                |
+--------------------------------------------------------------------------+
| Hyperscale Build Costs (Construct Elements)                              |
| $10M – $12M per Megawatt                                                 |
+--------------------------------------------------------------------------+
| 2025 Investment-Grade Debt Issuance (SIFMA via IMTC)                     |
| ~$1.7 Trillion (Near 2020 Record)                                        |
+--------------------------------------------------------------------------+
Financing the surge: near-record corporate debt
To finance physical infrastructure builds, refinance maturing debt, and fund corporate acquisitions, U.S. companies have tapped the bond market heavily. SIFMA figures cited by IMTC show that U.S. corporations issued approximately $1.7 trillion in investment-grade debt in 2025, approaching the historic high established in 2020.
Despite this elevated volume, high-grade financing conditions have stayed orderly. Investment-grade corporate bond spreads remain tight, supported by steady corporate fundamentals and broader economic expansion (IMTC).
However, high capital spending and large-scale borrowing increase ongoing financing obligations. Corporate bond issuance could set fresh records in 2026 due to growing capital projects and refinancing needs (IMTC), keeping debt obligations elevated on corporate balance sheets.
The macro backdrop: divergence in price gauges
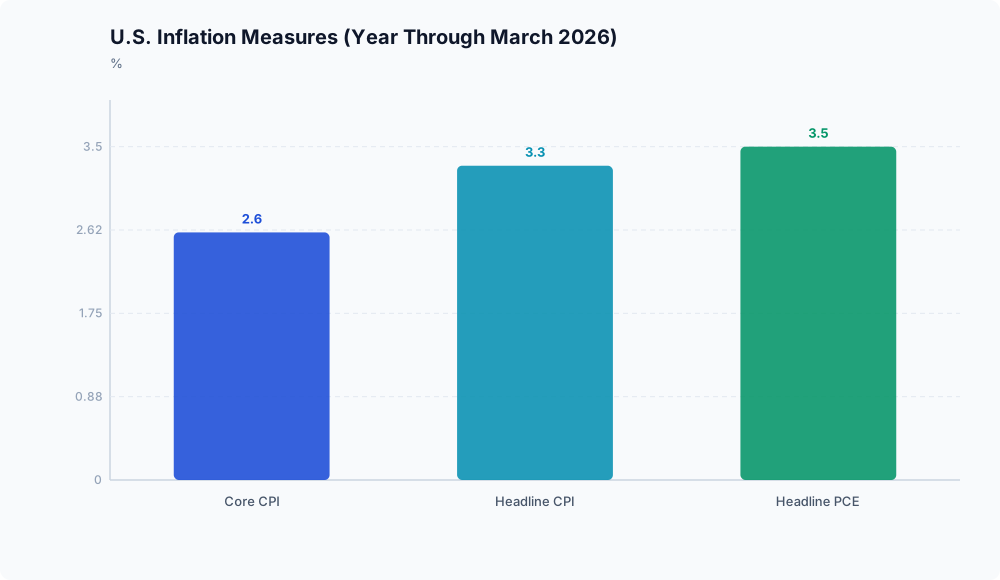
Capital allocation strategies in early 2026 must manage diverging inflation metrics. Economic policy data released by the U.S. Department of the Treasury highlights distinct paths between core and headline price gauges through March 2026:
- Core CPI moderated to 2.6% for the twelve months through March 2026, down from 2.8% for the twelve months through March 2025 (U.S. Department of the Treasury).
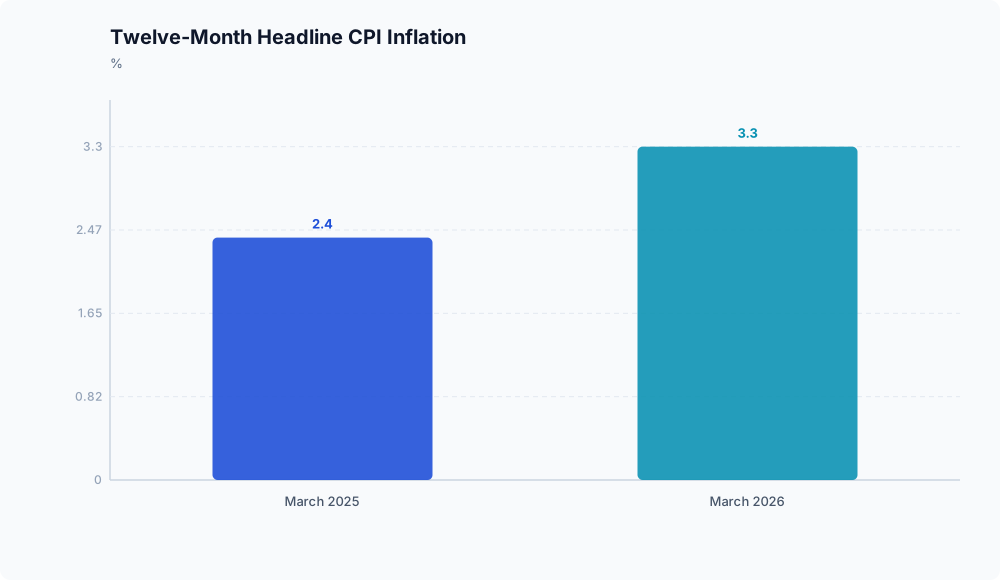
- Headline CPI accelerated to 3.3% over the twelve months through March 2026, rising from 2.4% through March 2025 (U.S. Department of the Treasury).
- The headline Personal Consumption Expenditures (PCE) price index rose to 3.5% through March 2026, up 1.1 percentage points from the 2.4% rate registered through March 2025 (U.S. Department of the Treasury).
March 2025 vs. March 2026 Inflation Comparison (U.S. Treasury)
Index                   March 2025    March 2026    Direction
-------------------------------------------------------------
Core CPI (12-Month)        2.8%          2.6%       Moderating
Headline CPI (12-Month)    2.4%          3.3%       Accelerating
Headline PCE (12-Month)    2.4%          3.5%       Accelerating
This divergence creates contrasting conditions for corporate planning. Core CPI cooling to 2.6% indicates that non-food and non-energy operating expenses have moderated (U.S. Department of the Treasury).
In contrast, headline inflation—nudged higher by an energy price surge of 12.5% over the twelve months through March 2026 (U.S. Department of the Treasury)—restrains monetary policy easing. With headline PCE standing at 3.5% against the Federal Reserve’s 2% target (U.S. Department of the Treasury), persistent inflation and heavy government borrowing may limit rate cuts and keep long-term borrowing yields elevated (IMTC).
Credit market risks and capital sustainability
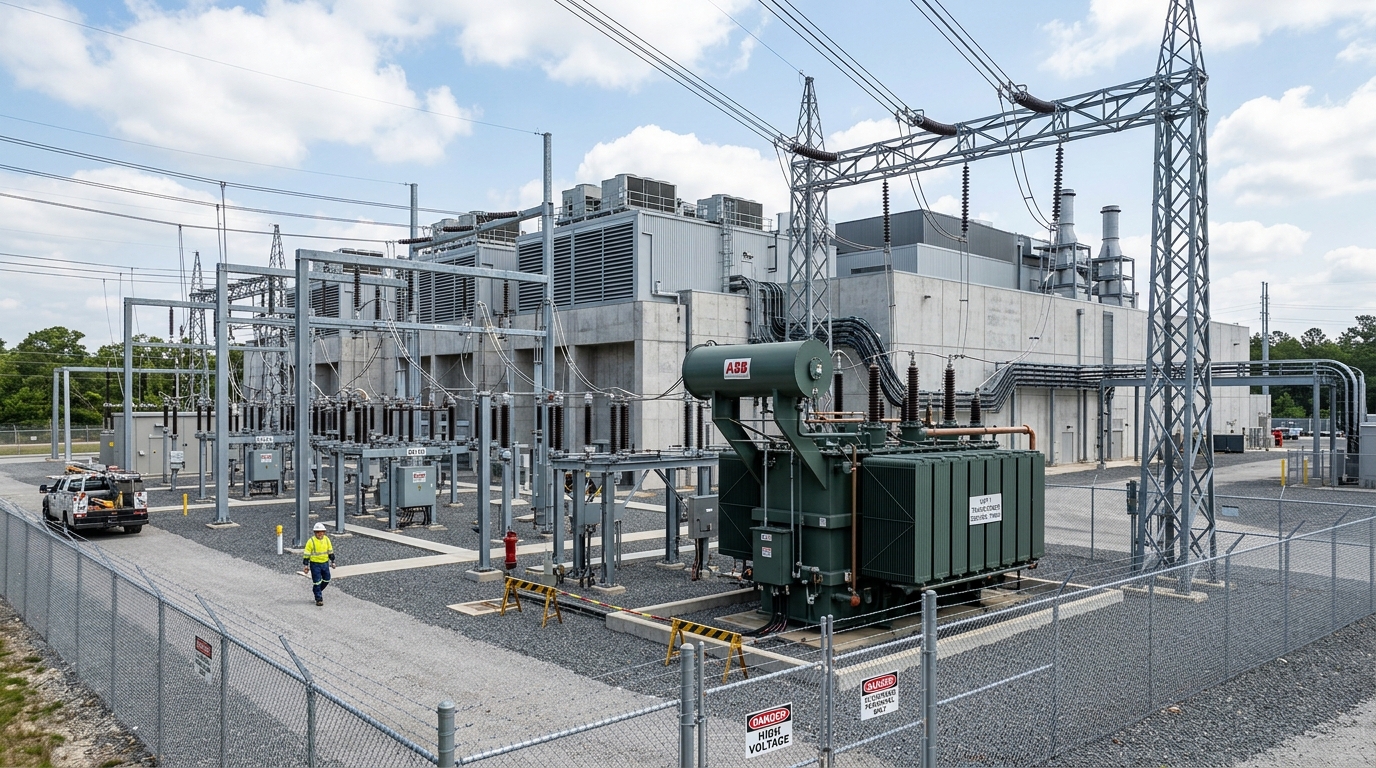
The interaction between heavy capital requirements and prolonged nominal borrowing costs presents key considerations across credit markets.
| Market Dynamics | Documented Metric / Observation | Analytical Implication |
|---|---|---|
| Capital Intensity | $10M–$12M per MW (AI Tool Discovery); $77.7B 2025 starts (AI Tool Discovery) | Multi-year facility development requires massive upfront capital commitments. |
| Debt Issuance | ~$1.7T in investment-grade debt in 2025 (IMTC) | Heavy borrowing funds infrastructure builds, debt refinancing, and M&A pipelines (IMTC). |
| Credit Spreads | Tight spreads supported by steady fundamentals (IMTC) | Resilient economic expansion maintains low corporate default risk (IMTC). |
| Borrowing Benchmark | Headline PCE at 3.5%; Headline CPI at 3.3% (U.S. Department of the Treasury) | Elevated headline inflation limits Fed rate cuts, keeping borrowing yields high (IMTC; U.S. Department of the Treasury). |
While solid macroeconomic growth continues to support high-grade corporate fundamentals, credit conditions remain divided. Lower-quality, highly leveraged market segments are showing signs of stress, particularly within private credit (IMTC).
Furthermore, if macroeconomic growth softens or labor markets weaken significantly, investment-grade credit spreads could widen, compounding interest burdens for companies carrying heavy debt loads (IMTC).
Conclusion

Documented metrics show an economy undergoing heavy physical asset accumulation: U.S. business fixed investment grew by over 10% in the first quarter of 2026 (U.S. Department of the Treasury), and domestic data center construction starts rose 190% in 2025 to $77.7 billion (AI Tool Discovery).
However, this capital expenditure cycle coincides with headline inflation of 3.3% CPI and 3.5% PCE through March 2026 (U.S. Department of the Treasury). While moderating core CPI at 2.6% indicates stable baseline costs (U.S. Department of the Treasury), sustaining near-record debt issuance of ~$1.7 trillion (IMTC) under high nominal interest rates requires corporate earnings and operational returns to keep pace with rising interest expenses.
Disclaimer: This analysis is for informational purposes only and does not constitute investment, financial, real estate, or legal advice. Always consult a licensed financial advisor before making investment decisions.