
Multifamily Rent Disinflation Pressures Landlord Margins
Multifamily rent disinflation: navigating the gap between shelter costs and headline inflation
Slowing rent growth has created a negative real spread for residential landlords. While broader economic activity and headline inflation are rising, rent growth has fallen below general price increases. This compresses operating margins for multifamily operators whose general operating expenses track broader headline inflation while shelter costs slow.
Divergence in domestic price pressures
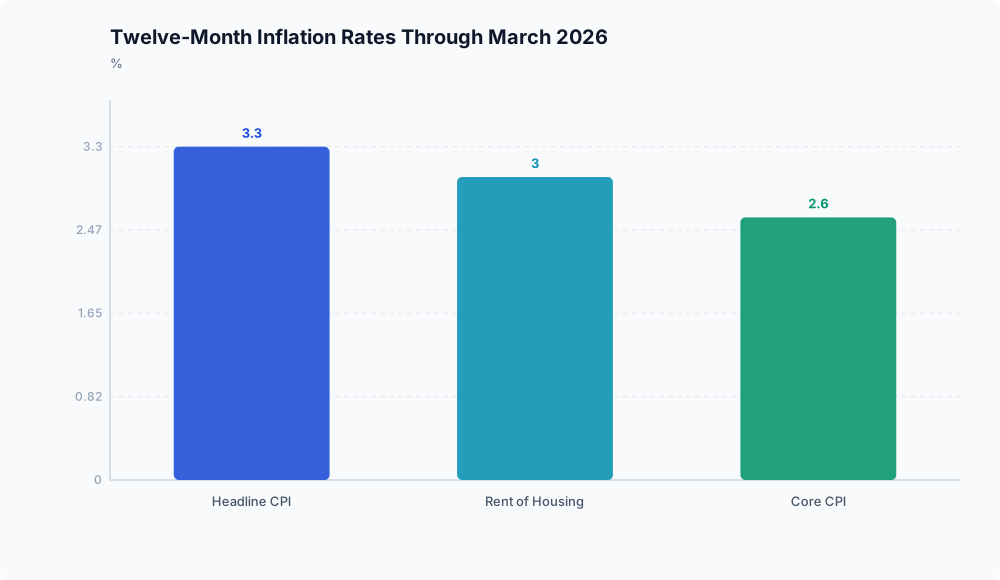
Over the twelve months through March 2026, rent of housing inflation decelerated to 3.0%, according to the U.S. Department of the Treasury. This reading falls below the pre-pandemic benchmark of 3.3% and marks the slowest annual pace recorded since September 2021.
This moderation in housing services helped cool underlying price metrics. Twelve-month core Consumer Price Index (CPI) inflation dropped to 2.6% through March 2026 from 2.8% a year earlier, as reported by the U.S. Department of the Treasury.
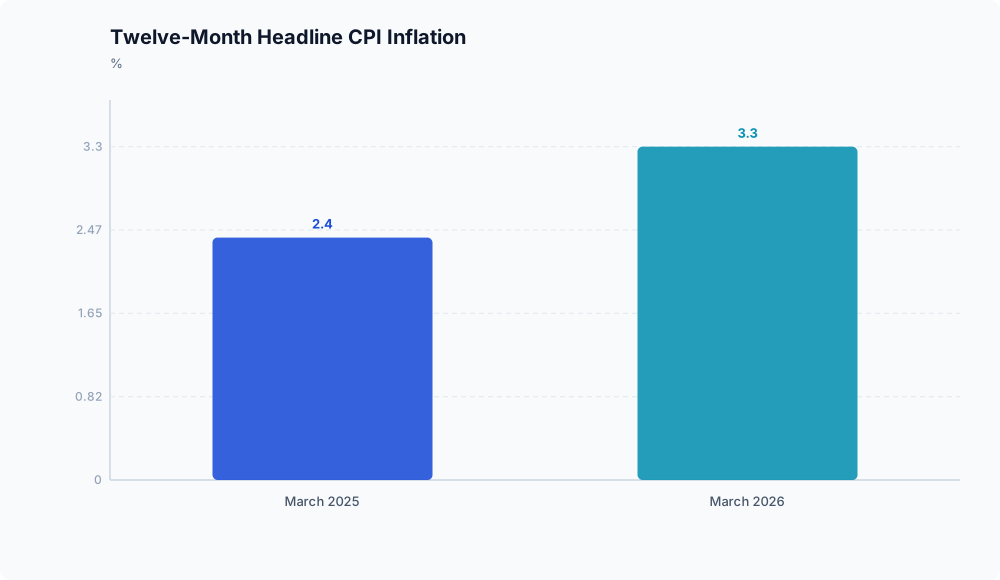
At the same time, top-line economic measures moved higher. Twelve-month headline CPI climbed to 3.3% as of March 2026, up from the 2.4% annual pace recorded through March 2025, according to the U.S. Department of the Treasury.
Underlying economic output also picked up speed: real GDP growth expanded at an annualized rate of 2.0% in the first quarter of 2026, rebounding from 0.5% growth at the close of 2025 (U.S. Department of the Treasury).
+-------------------------------------------------------------+
| Inflation & Output Trends (12 Months Through March 2026)    |
+------------------------------------+------------------------+
| Headline CPI Inflation             | 3.3% (up from 2.4%)    |
| Rent of Housing Inflation          | 3.0% (down from 3.3%*) |
| Core CPI Inflation                 | 2.6% (down from 2.8%)  |
| Real GDP Growth (Q1 2026 Ann.)     | 2.0% (up from 0.5%)    |
+------------------------------------+------------------------+
*Pre-pandemic benchmark. Data: U.S. Department of the Treasury.
Operational pressures on multifamily operators
Because housing rent is a large and historically sticky component of the consumer basket, its retreat shows that cyclical domestic price pressures have eased even as headline inflation accelerated. For property managers and owners, however, this split presents operational hurdles.
When rent growth slows to 3.0% against headline inflation of 3.3%, residential revenue fails to keep pace with wider consumer price changes, as tracked by the U.S. Department of the Treasury. If property-level operating expenses (such as maintenance materials, utilities, energy, and contracted labor) rise alongside headline inflation rather than the lower core rate, expense growth will overtake top-line rental receipts.
This limits an owner’s pricing power, squeezes operating profit margins, and often leads to promotional concessions to preserve occupancy.
Analytical limits and submarket realities
While resilient GDP growth typically supports tenant employment and aggregate leasing demand, observed macroeconomic data does not guarantee stable property yields. The available evidence demonstrates a contemporaneous divergence between shelter costs and broader economic indicators, but it does not establish a permanent or uniform causal path.
Current data leaves critical variables open. Available metrics do not show whether rent deceleration will continue or if accelerating GDP growth will eventually feed back into service-sector prices. National aggregate CPI data also does not provide line-item detail for major property-level expenses, such as local property taxes, insurance premiums, or municipal utility hikes. In addition, headline figures do not reflect specific lease concessions across regional submarkets.
Consequently, the severity of net operating income (NOI) compression will differ across markets depending on localized supply-demand balances and specific property cost profiles.
Conclusion

The data confirms that residential rent growth is no longer outpacing aggregate inflation. For multifamily investors and operators, economic expansion is currently paired with diminishing pricing leverage. Managing margin health will depend on controlling line-item operational expenses and evaluating local supply conditions, as top-line rent increases can no longer be relied on to outrun general inflation.
Disclaimer: This analysis is for informational purposes only and does not constitute investment, financial, real estate, or legal advice. Always consult a licensed financial advisor before making investment decisions.