
Navigating the 10-Year Treasury Yield Valuation Squeeze
Navigating the 10-year Treasury yield valuation squeeze
An elevated 10-year Treasury yield raises the hurdle rate across capital assets. When sovereign benchmark yields hold near multi-year highs while economic growth moderates, equity valuations face two distinct pressures: future corporate earnings are discounted at a higher rate, and risk-free debt offers a competitive yield relative to equities.
On September 28, 2026, the S&P 500 fell 0.77% to close at 7,683.69 as the benchmark 10-year U.S. Treasury yield settled at 5.24%, according to FinLore.
Valuation friction in a slower growth climate
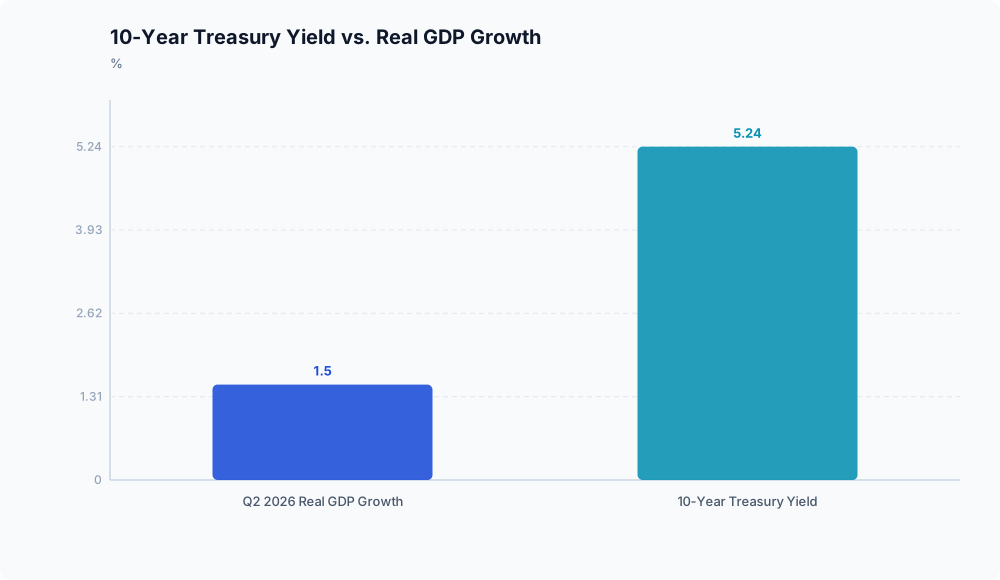
This pressure coincided with cooling domestic output. U.S. real GDP grew at an annualized rate of 1.5% in the second quarter of 2026, as reported by FinLore.
A 5.24% benchmark sovereign yield alongside a 1.5% annualized expansion rate points to tighter financial conditions (FinLore). In discounted cash flow (DCF) models and capital asset pricing models, the 10-year yield serves as the risk-free baseline. When that baseline climbs, a company’s weighted average cost of capital (WACC) increases accordingly.
Holding profit expectations steady, this shift narrows the equity risk premium (ERP), the return investors require above government debt to justify equity risk. With guaranteed yields at 5.24% (FinLore), asset allocators re-evaluate whether expected equity returns justify the added volatility.
Multiple compression and duration risk
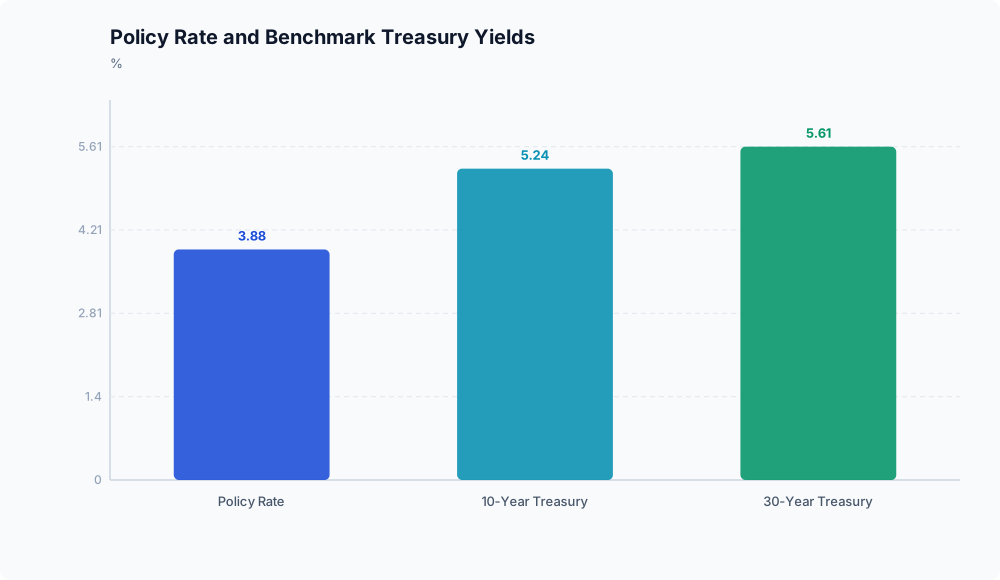
Higher discount rates fall heaviest on long-duration assets. Companies whose projected cash flows sit further out, including growth stocks and companies trading at high valuation multiples, face downward valuation adjustments as future earnings are discounted more heavily.
As tracked by FinLore, the S&P 500’s decline to 7,683.69 reflects this dynamic. While the baseline return on risk-free debt remains above 5%, broad equity multiples generally contract unless upward revisions to earnings growth offset the drag.
Corporate balance sheets face the squeeze

Outside valuation models, elevated benchmark yields raise marginal borrowing costs and debt-refinancing expenses for corporations.
Higher rates combined with slower top-line expansion compress corporate margins. Debt servicing costs increase while revenue growth softens alongside the 1.5% GDP run-rate (FinLore), creating refinancing hurdles for heavily leveraged balance sheets.
The available market data does not include aggregate default rates or specific credit spread metrics, leaving the exact level of systemic credit distress across corporate balance sheets unclear.
Analytical takeaway

For equity allocators, while sovereign yields remain above 5% alongside modest economic growth, expanding valuation multiples are unlikely to drive broad indices higher. Without stronger earnings growth or lower long-term borrowing costs, equity valuations will stay constrained by the yields available on risk-free Treasuries.
Disclaimer: This analysis is for informational purposes only and does not constitute investment, financial, real estate, or legal advice. Always consult a licensed financial advisor before making investment decisions.