Shelter Inflation and Multifamily NOI Trends in 2026
Multifamily NOI under pressure: stalled rent growth meets expanded debt liquidity
How do shelter inflation and multifamily NOI trends interact in 2026?
Stagnant rent growth directly compresses property-level net operating income (NOI) and tightens debt service coverage ratios (DSCR), even as occupancy stabilizes and government-sponsored enterprises expand lending capacity. Because average rents are growing at near-zero rates while concessions widen, property owners cannot rely on revenue gains to absorb potential operating cost increases, leaving recapitalizations dependent on debt paydowns or fresh equity.
Operational drag: supply overhang and concessions
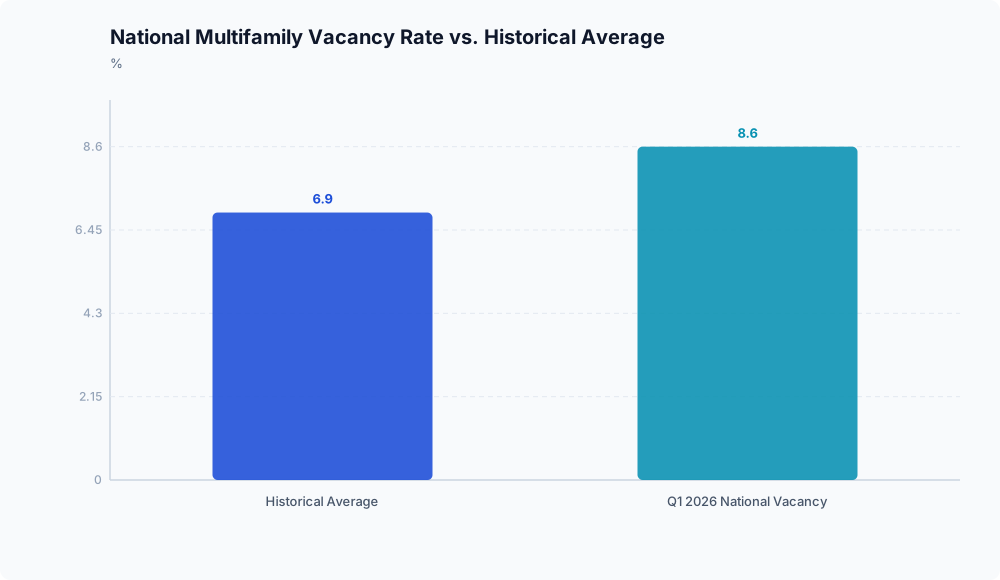
U.S. multifamily revenue growth stalled in the first quarter of 2026 under the weight of new construction. According to MMCG, the national apartment footprint reached approximately 20.7 million units across roughly 433,000 buildings in Q1 2026. This inventory pushed national vacancy to 8.6%, above the historical average of roughly 6.9% reported by MMCG.
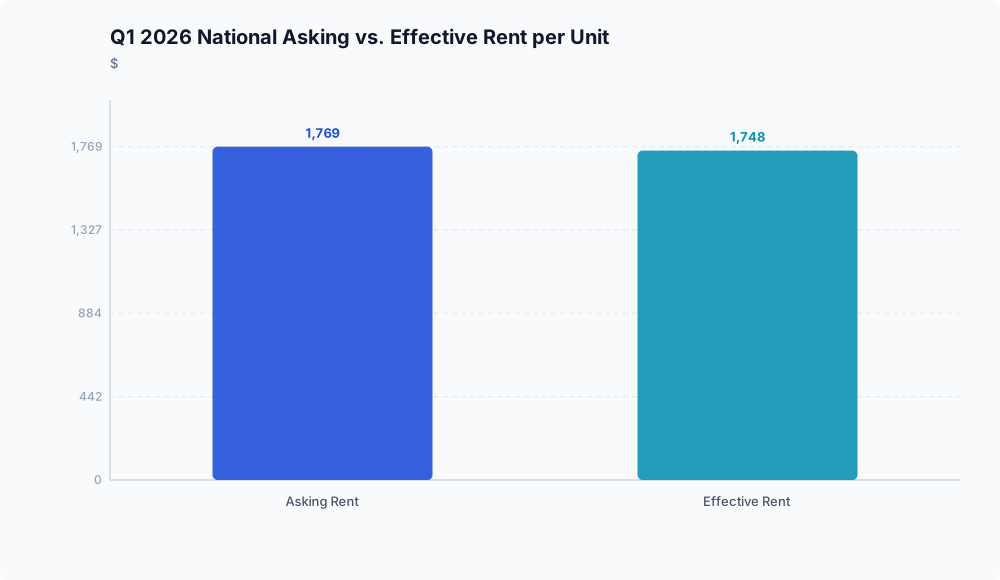
The excess supply has reduced landlord pricing power, prompting operators to discount units to maintain occupancy. As reported by MMCG, national average asking rents stood at $1,769 per unit ($1.97 per square foot) during Q1 2026, while realized effective rents averaged $1,748 per unit. The difference shows how asking rents obscure concessions offered to compete against unleased inventory.
Measuring stagnation across market datasets
Sector-wide deceleration appears across major trackers, though baseline figures vary by methodology. Unlike MMCG, market data from Cornovus Capital indicates that national vacancy fell 20 basis points sequentially to 4.8% in Q1 2026, with average monthly rent rising 0.2% year over year to $2,217.
The divergence between the 8.6% vacancy reported by MMCG and the 4.8% metric from Cornovus Capital reflects differences in sample composition, including geographic scope and property tiers. Despite these baseline variations, both datasets show that annual contract rent growth has nearly stopped.
The transmission to NOI and debt service coverage
Stagnant revenue directly affects property balance sheets. When gross revenue rises by only 0.2% annually, as recorded by Cornovus Capital, any unmeasured inflationary pressure on operating expenses such as taxes, labor, or insurance reduces NOI margins. Because line-item operational costs are unquantified in the immediate property data, the precise rate of margin compression cannot be measured directly from these figures, though the exposure remains clear.
Weaker NOI complicates refinancing for maturing loans. Lower operational margins reduce the debt service an asset can support, thinning DSCR buffers unless loan balances are reduced.
Capital availability does not equal organic demand
To support liquidity as debt matures, agency lenders have expanded capacity. The Federal Housing Finance Agency set 2026 loan purchase caps for Fannie Mae and Freddie Mac at $88 billion each, creating a combined $176 billion lending capacity that represents a 20.5% increase over 2025 allocations, according to Cornovus Capital.
While this debt backstop helps prevent a wider liquidity shortage, available credit cannot generate tenant demand. The physical supply of roughly 20.7 million units documented by MMCG remains the governing constraint on rent growth. Government-sponsored enterprise liquidity gives borrowers options to restructure, but without pricing power, owners refinancing loans will need equity contributions or principal paydowns to bridge coverage gaps.
Implications for borrowers and lenders
Operational performance has decoupled from debt liquidity. Ample GSE lending capacity ensures refinancing channels exist, but near-zero rent growth and elevated supply mean operations cannot offset aggressive underwriting. Maintaining sustainable cash flows in 2026 will depend on defending effective rent collections and restructuring debt rather than relying on market-wide rent acceleration.
Disclaimer: This analysis is for informational purposes only and does not constitute investment, financial, real estate, or legal advice. Always consult a licensed financial advisor before making investment decisions.
Frequently asked questions

Why might broader shelter inflation measures diverge from new market-rate lease trends? Direct macroeconomic measures of shelter inflation are unquantified in the available property-level datasets. Market-rate lease trackers evaluate current transaction activity, such as asking rents of $1,769 and effective rents of $1,748 reported by MMCG, alongside a 0.2% annual rent increase noted by Cornovus Capital. Broader aggregate metrics often lag spot leasing conditions because they reflect long-term in-place leases across broader housing categories.
How are multifamily operators defending NOI margins in markets where vacancies exceed historical averages? Operators are primarily using concessions to protect physical occupancy against the 20.7 million-unit national supply base reported by MMCG. On balance sheets, owners facing tight debt service coverage are using refinancing liquidity, including the $176 billion Fannie Mae and Freddie Mac lending allocation reported by Cornovus Capital, backed by equity injections or principal paydowns. Specific expense-reduction tactics are not quantified in the available data.