
AI Capex Corporate Debt Issuance and Market Dynamics
AI Capex and Corporate Debt: How the Infrastructure Boom Is Reshaping Markets
Upstream semiconductor and hardware component suppliers are capturing the immediate cash gains from artificial intelligence infrastructure spending, while the cloud hyperscalers funding the buildout face compressed free cash flow, component inflation, and rising debt-servicing costs. Hyperscalers have committed historic sums to data center capacity, lifting business fixed investment and issuing large volumes of corporate debt.
Macroeconomic data reflects this wave of capital deployment along with its differing financial effects across corporate balance sheets.
Macroeconomic rebound fueled by fixed investment
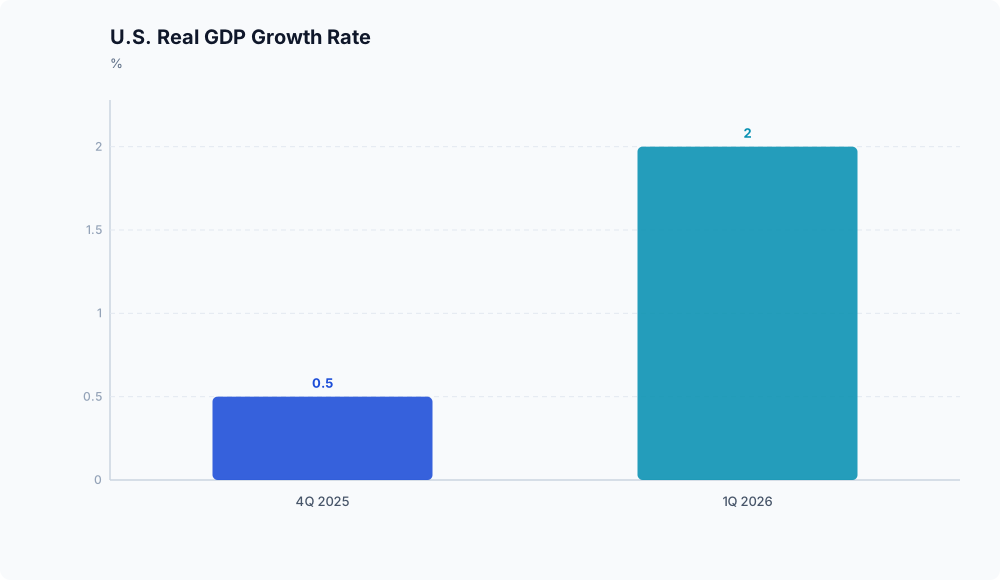
U.S. economic activity picked up significantly at the start of 2026. Real GDP expanded at an annualized rate of 2.0% in the first quarter of 2026, accelerating from 0.5% in the final quarter of 2025, according to the U.S. Department of the Treasury.
Business fixed investment led this acceleration, rising by more than 10% in the first quarter. Official figures cite outlays for new equipment and intellectual property (IP) as catalysts behind the expansion.
U.S. Real GDP Growth (Annualized)
Q4 2025:  [0.5%]
Q1 2026:  [======== 2.0% ]
▲ +1.5% acceleration
While market commentary widely links this double-digit capital surge to physical AI infrastructure (such as high-density data centers, custom silicon, and power systems), the underlying economic data warrants analytical caution. The U.S. Department of the Treasury groups these expenditures under aggregate equipment and IP instead of isolating AI facilities as an independent statistical metric. Large-scale enterprise computing architectures fit within equipment and software categories, but attributing a specific dollar volume exclusively to AI infrastructure is an analytical synthesis; official government reports do not isolate the figure.
Persistent inflation and restrictive debt markets
This capital investment cycle is taking place in an uneven pricing environment. According to the U.S. Department of the Treasury, twelve-month core Consumer Price Index (CPI) inflation eased to 2.6% in March 2026, down from 2.8% over the year through March 2025.
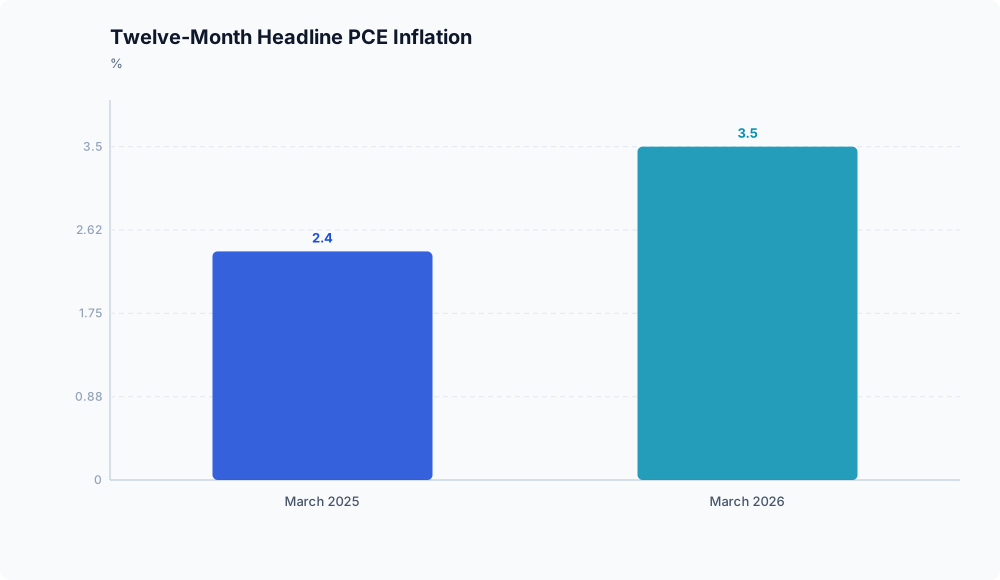
However, broader inflation signals re-accelerated: the twelve-month headline Personal Consumption Expenditures (PCE) price index climbed to 3.5% through March 2026, an increase of 1.1 percentage points compared to the 2.4% rate registered through March 2025.
Inflation Trends (Twelve-Month Through March)
┌──────────────┬──────────┬──────────┬────────────────────────┐
│ Metric       │ Mar 2025 │ Mar 2026 │ Direction              │
├──────────────┼──────────┼──────────┼────────────────────────┤
│ Core CPI     │ 2.8%     │ 2.6%     │ -0.2% (Moderating)     │
│ Headline PCE │ 2.4%     │ 3.5%     │ +1.1% (Accelerating)   │
└──────────────┴──────────┴──────────┴────────────────────────┘
Source: U.S. Department of the Treasury
The persistence of headline PCE price pressures alongside core CPI moderation provides fixed-income markets with clarity on baseline policy, but indicates borrowing costs will remain elevated.
Most Fed watchers project two interest rate cuts in 2026, leaving the federal funds target rate between 3.0% and 3.5% by year-end, as reported by IMTC. Consequently, businesses issuing debt must service their obligations under comparatively restrictive hurdle rates.
The balance-sheet divide: hardware vendors vs. hyperscalers
Capital commitments required for AI computing have produced divergent financial outcomes along the tech supply chain. Combined hyperscale capital expenditures are projected to top $800 billion in 2026, a 67% increase year-over-year, before crossing $1 trillion in 2027, according to BofA Global Research estimates reported by Yahoo Finance Australia.
| Metric / Event | Projection / Figure | Reporting Source |
|---|---|---|
| 2026 Projected Hyperscale Capex | >$800 billion (+67% YoY) | BofA via Yahoo Finance Australia |
| 2027 Projected Hyperscale Capex | >$1 trillion | BofA via Yahoo Finance Australia |
| Microsoft Component Price Capex Impact | $25 billion of 2026 capex growth | Yahoo Finance Australia |
| 2025 U.S. Investment-Grade Debt Issuance | ~$1.7 trillion | SIFMA via IMTC |
For semiconductor and equipment suppliers, these expenditures translate into sustained backlogs and pricing power. High component pricing is directly inflating buyer budgets: Microsoft reported that $25 billion of its 2026 capex increase stems purely from higher component prices, as noted by Yahoo Finance Australia. Hardware providers are passing along input costs, securing upfront, high-margin revenue.
In contrast, the hyperscalers paying these invoices absorb compressed cash conversion and heavy financing demands. U.S. corporations issued roughly $1.7 trillion in investment-grade debt in 2025, nearing the record set in 2020, according to SIFMA data reported by IMTC.
While specific enterprise cash-preservation strategies cannot be established from aggregate debt metrics alone, elevated bond issuance paired with benchmark policy rates between 3.0% and 3.5% means debt-funded capex carries meaningful interest burdens that will linger on corporate balance sheets.
Pressuring the equity risk premium
The intersection of heavy corporate borrowing and persistent interest rates is influencing broader asset allocation. An issuance volume near $1.7 trillion provides institutional portfolios with an abundance of investment-grade paper yielding historically competitive returns, supported by a growing economy and resilient headline PCE inflation.
This fixed-income environment compresses the institutional equity risk premium (ERP), defined as the excess return investors require to hold equities instead of higher-quality corporate debt.
Because official datasets do not measure daily fund flows or forward tech earnings yields, an outright causal rotation from tech equities into corporate paper is an analytical deduction rather than an established market certainty. Nevertheless, when investment-grade paper offers dependable nominal yields against 3.0% to 3.5% policy rates, richly valued large-cap tech equities face a higher hurdle rate to justify their risk profiles.
Operational impact across the supply chain

Capital spending on AI infrastructure has driven broader U.S. economic growth, but the financial returns are distributed unevenly across the technology supply chain.
Hardware and semiconductor suppliers gain multi-year revenue visibility, sustained order backlogs, and pricing leverage. Cloud hyperscalers, meanwhile, face higher hardware input costs while managing substantial debt-service obligations in an environment with higher interest rates. In financial terms, upstream suppliers are generating cash upfront, while hyperscalers are financing the buildout through debt and compressed free cash flow.
Disclaimer: This analysis is for informational purposes only and does not constitute investment, financial, real estate, or legal advice. Always consult a licensed financial advisor before making investment decisions.
Frequently asked questions

How does elevated corporate bond issuance affect the equity risk premium of large-cap tech stocks?
Elevated corporate bond supply paired with projected year-end federal funds rates of 3.0% to 3.5%, as reported by IMTC, keeps high-grade yields attractive. When institutional investors can capture dependable yields from investment-grade corporate bonds, the expected excess return demanded for holding tech equities at elevated valuations increases, compressing the relative equity risk premium.
Why are cash-rich hyperscalers issuing long-term debt rather than exclusively using operating cash flow for AI capex?
Aggregated market data from BofA reported by Yahoo Finance Australia projects hyperscale capex to exceed $800 billion in 2026 and $1 trillion in 2027, driven in part by higher component pricing. Issuing investment-grade debt, which approached a record $1.7 trillion across U.S. corporations in 2025, according to SIFMA via IMTC, allows companies to fund these capital programs without depleting short-term operational liquidity, even though it adds long-term interest expenses.