
How Rising Treasury Yields Push CRE Cap Rates Upward
How rising benchmark yields pressure commercial real estate cap rates
When risk-free benchmark yields rise, debt financing costs increase across commercial property markets. If the cost of borrowing climbs above a property’s entry capitalization rate (the ratio of net operating income to purchase price), the asset enters negative leverage. Under negative leverage, debt service erodes equity returns, forcing capitalization rates upward and asset prices downward until equity risk premia are restored.
Macroeconomic catalyst: strong labor, sticky inflation, and policy tightening
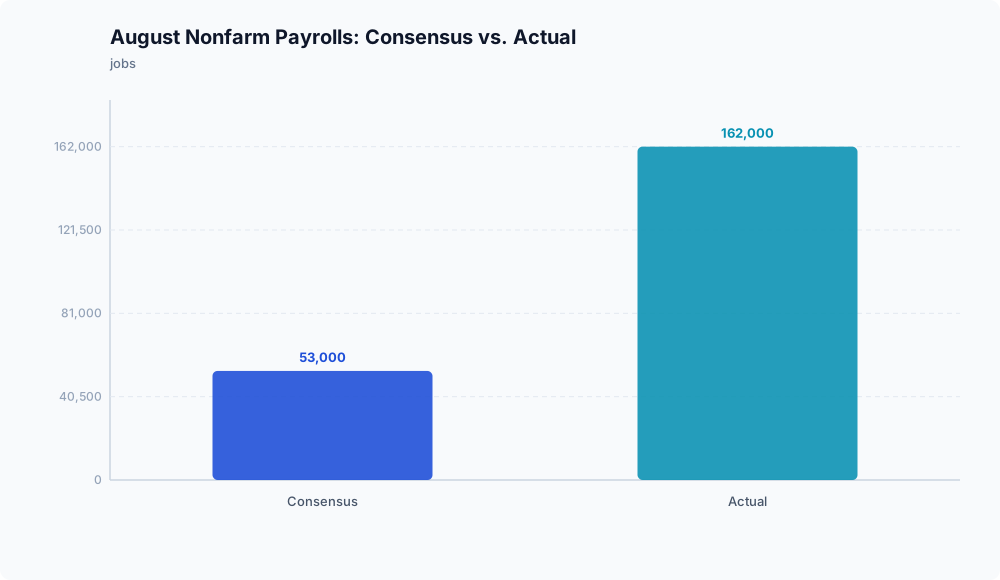
The upward pressure on benchmark yields stems from economic resilience and the Federal Reserve’s monetary response. In the United States, labor market indicators showed unexpected strength when nonfarm payrolls expanded by 162,000 jobs in August 2026, significantly surpassing the consensus estimate of 53,000, according to Crestwood Advisors.
Inflation also remained persistent. August 2026 headline Consumer Price Index (CPI) inflation advanced 0.4% month-over-month and 3.4% year-over-year, matching consensus expectations and holding flat relative to July, as detailed by Crestwood Advisors.
Because employment remained strong and headline inflation stalled above central bank targets, policymakers raised rates. On September 16, 2026, the Federal Reserve voted unanimously (12 to 0) to raise the federal funds target range to 3.75% to 4%, as reported by Crestwood Advisors. Policymakers also projected a median year-end 2026 federal funds rate of 4.1%, per Crestwood Advisors, signaling that policy rates would stay elevated.
Transmission to real estate: capital costs and negative leverage
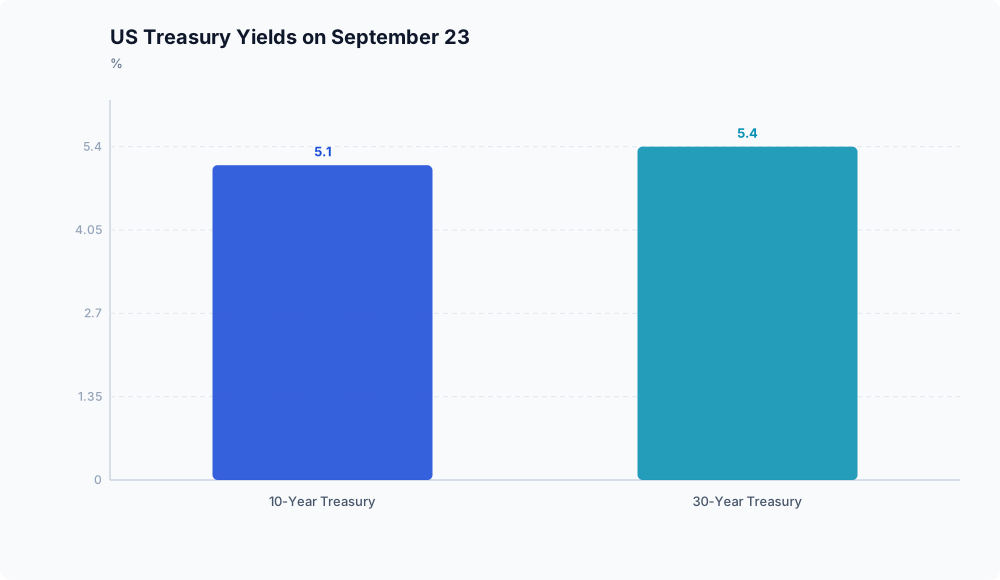
This monetary policy feeds directly into commercial property capital structures through the cost of debt. A projected policy rate above 4% establishes a higher floor for risk-free benchmark yields and commercial mortgage rates.
When borrowing rates exceed the entry capitalization rate of an acquisition, the deal enters negative leverage:
- The annual cost of servicing debt surpasses the property’s unlevered yield (net operating income divided by purchase price).
- Debt reduces levered cash flows to equity investors.
- Capital allocators must revise their hurdle rates upward, widening required return spreads over debt yields.
Because net operating income yields and property valuations move in opposite directions, capitalization rates must adjust upward to re-establish an acceptable equity risk premium over higher base yields. Mechanically, without immediate and proportional net operating income growth, expanding cap rates require lower commercial asset valuations.
Analytical boundaries and data limitations
While financial theory demonstrates how higher benchmark rates lead to negative leverage and cap rate expansion, empirical conclusions remain bounded by the available evidence.
The underlying macroeconomic reports establish policy rate actions and employment figures, but they do not provide direct commercial real estate performance indicators. Specifically, the data lacks:
- Observed private transaction capitalization rates across property sectors.
- Realized commercial mortgage lending spreads.
- Sector-level asset appraisal write-downs.
- Quantitative measurements of property transaction velocity or buyer-seller bid-ask spreads.
While underwriting logic indicates that deal flow faces friction and pricing must adjust to a 3.75% to 4% policy environment, the exact pace of adjustment and the precise depth of commercial property value declines cannot be measured without asset-level transaction records.
Conclusion

A higher policy path resets the baseline for capital allocation. For real estate investors, the combination of a 3.75% to 4% policy range and a 4.1% year-end projection indicates that elevated debt costs will persist. Unless operating income accelerates enough to offset debt service burdens, baseline financial mechanics require capitalization rates to widen, shifting property underwriting toward lower entry valuations and conservative leverage profiles.
Disclaimer: This analysis is for informational purposes only and does not constitute investment, financial, real estate, or legal advice. Always consult a licensed financial advisor before making investment decisions.
Frequently asked questions

What is negative leverage, and why does it require cap rates to expand? Negative leverage occurs when the interest rate or total yield on debt exceeds the unlevered yield (the capitalization rate) of the underlying property. Because the debt absorbs more cash flow than the asset produces proportionately, equity yields decline as leverage increases. To make an acquisition viable for equity investors, property prices must fall until the entry capitalization rate rises back above the cost of borrowing.
How does the historical spread between the 10-year Treasury yield and commercial cap rates compare to current levels? The provided macroeconomic data does not contain historical or current commercial real estate capitalization rate data, nor does it track private mortgage spreads against the 10-year Treasury. While benchmark risk-free rates and monetary targets are documented, quantifying the exact current spread requires property-level transaction benchmarks that are not present in the current dataset.