
10-Year Treasury Yield Spike and Equity Multiple Compression
10-year Treasury yield spike and equity multiple compression
Can growth stock valuations withstand a 10-year Treasury yield anchored near 5.3% without significant multiple compression?
In the short term, equity markets can absorb higher yields through a narrower equity risk premium or upgraded growth projections, but higher borrowing costs still weigh on valuation models. A sustained risk-free rate near 5.3% depresses equity multiples by heavily discounting distant earnings. While interest rate futures have eased recently, forward curves show that capital costs are projected to remain well above Federal Reserve baseline estimates through late 2027, reducing the valuation cushion for long-duration assets.
Yield environment and the drop in near-term hike odds
The current rate environment combines an elevated yield curve with an active Federal Reserve tightening cycle. At its September 2026 meeting, the central bank raised its policy target range by 25 basis points to 3.75% to 4.00%, as reported by Investing.com. Long-term yields moved higher as well, with the 10-year U.S. Treasury yield holding near 5.3% in early October after briefly touching the mid-5.3% range earlier in the month.
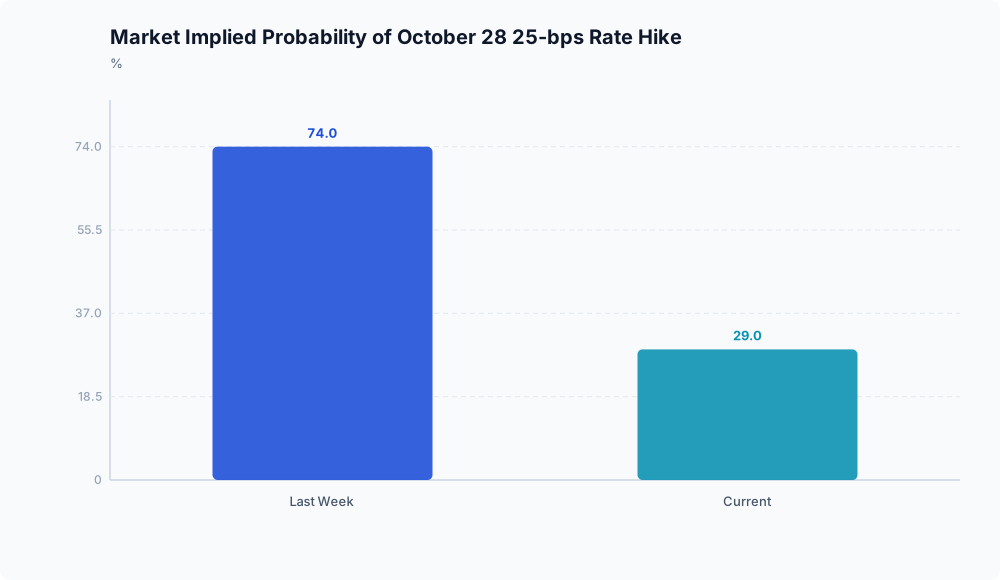
Short-term rate expectations adjusted downward following softer inflation data. According to data from the Federal Home Loan Bank of New York for the week ending October 2, 2026, the market-implied probability of an additional 25-basis-point hike at the October 28 FOMC meeting fell to 29%, down from 74% the previous week.
This shift lowered the 2026 year-end forward rate by 12.5 basis points over the week to 4.14%, an implied path pointing to roughly one additional quarter-point increase for the calendar year, as documented by the Federal Home Loan Bank of New York.
Multiple compression math and market divergence
Under discounted cash flow (DCF) models, growth technology companies derive most of their estimated valuation from cash flows projected years into the future. The discount rate applied to those distant cash flows incorporates the risk-free benchmark ($R_f$). Because long-duration cash flows are especially sensitive to rates, discounting them against a 10-year Treasury yield near 5.3%, as noted by Investing.com, reduces their present value considerably.
A 5.3% risk-free rate also compresses the equity risk premium (ERP), the excess return investors require above government bond yields. When risk-free yields reach multi-decade highs, equity earnings yields typically rise, which pushes valuation multiples down, unless investors accept lower risk compensation.
Recent trading diverged from this pattern. Even with the 10-year yield holding near 5.3%, Nasdaq 100 December futures climbed from roughly 30,760 in early October to pass 31,600 during a single Tuesday session, according to Investing.com.
Equity markets absorbed higher discount rates by accepting a lower risk buffer and focusing on near-term earnings strength. That resilience reflects short-term risk appetite. If near-term cash-flow growth slows down, valuation multiples could contract quickly.
Front-end repricing and the terminal rate floor

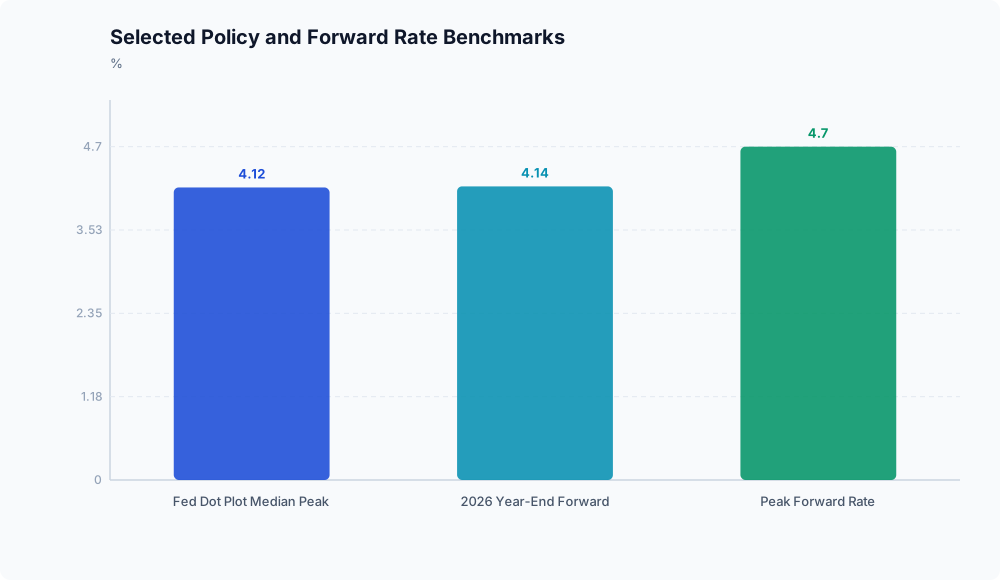
The decline in near-term hike expectations has not lowered the broader cost of capital. The October rate hike probability dropped to 29% and the projected peak forward rate fell 15 basis points week over week, but that peak rate, projected for October 2027, remains at 4.70%, according to the Federal Home Loan Bank of New York.
That market-implied peak of 4.70%, which reflects roughly 3.3 additional 25-basis-point rate increases, remains higher than the Federal Reserve’s dot plot median peak of 4.125%, as reported by the Federal Home Loan Bank of New York.
This difference helps explain why 10-year Treasury yields have remained near 5.3% despite lower odds of an October hike. Investors are pricing in prolonged restrictive monetary policy. The weekly decline in forward rates reflects an adjustment for an individual policy meeting, while overall capital costs remain elevated.
Analytical takeaway

For equity investors, the data indicates that capital costs will likely stay higher through late 2027. Brief pullbacks in policy rate expectations can spark rallies in technology futures, but long-duration stocks remain constrained by discount rates above 5%. Until forward curves point to lower terminal rates or earnings growth outpaces the effect of higher discounting, elevated valuation multiples leave little room for operational misses.
Disclaimer: This analysis is for informational purposes only and does not constitute investment, financial, real estate, or legal advice. Always consult a licensed financial advisor before making investment decisions.