Shelter Disinflation and Multifamily Margins: NOI Trends
Shelter disinflation and multifamily margins: Navigating revenue deceleration and loan maturities
How does the deceleration in shelter inflation affect multifamily operating margins and debt refinancing?
Slower official shelter inflation reflects broader stagnation in private rental fundamentals, directly narrowing property owners’ top-line revenue growth. With asking rent growth near zero and national vacancies at post-financial-crisis highs, property net operating income (NOI) faces compression. For owners with maturing debt, reduced cash flow undercuts debt-service coverage ratios (DSCR), limiting borrowing capacity and forcing either cash equity injections or property repricing.
Official housing measures register pronounced cooling
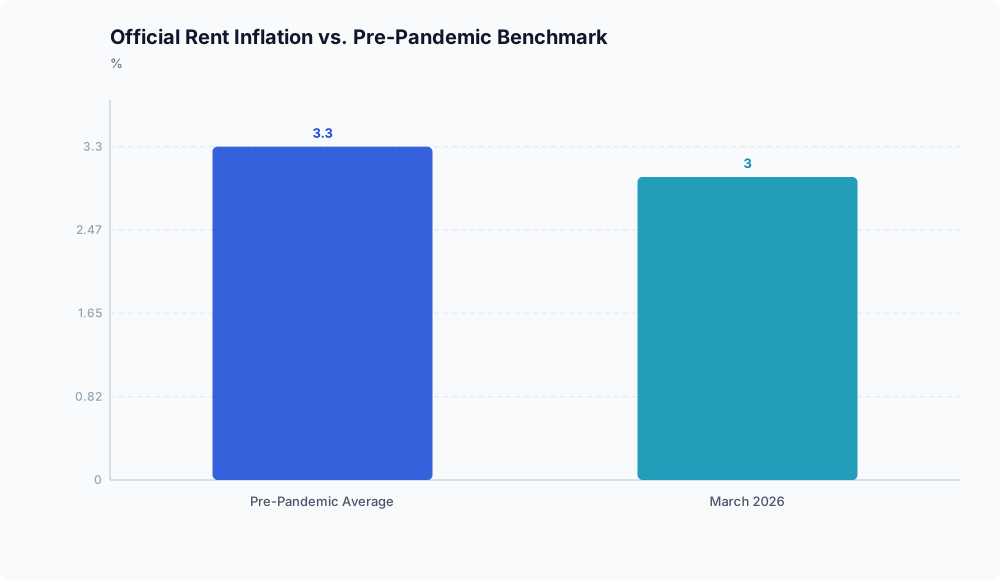
Government inflation metrics show that shelter price growth has returned to below pre-pandemic norms. According to the U.S. Department of the Treasury, rent of housing inflation decelerated to 3.0% over the year through March 2026. This is the slowest pace recorded since September 2021 and sits beneath the pre-pandemic benchmark of 3.3%.
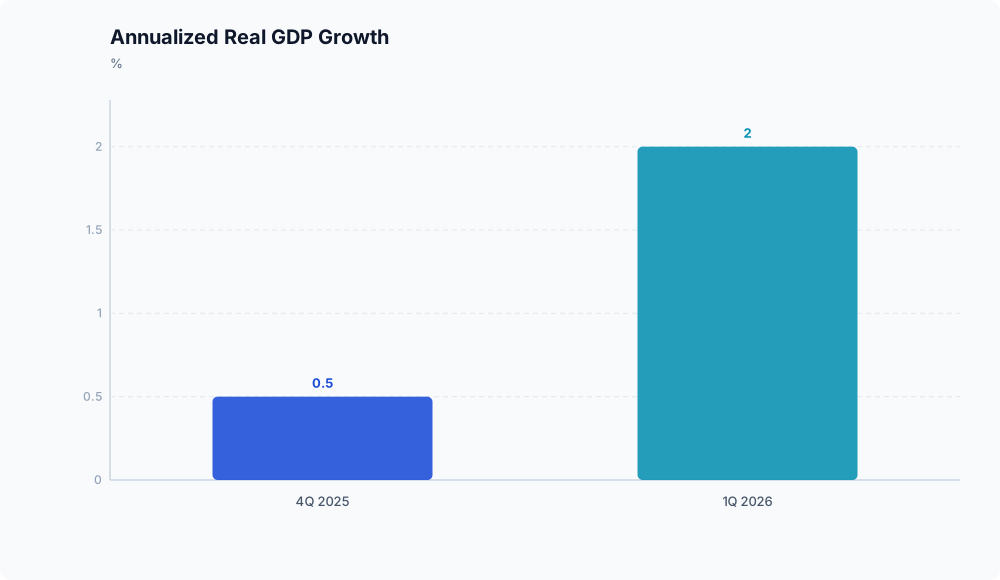
This slowdown unfolded alongside broader economic expansion. The U.S. Department of the Treasury reported that annualized real GDP growth reached 2.0% in the first quarter of 2026, rebounding from 0.5% growth in the final quarter of 2025.
Because official shelter inflation captures rents across existing and newly signed leases, it historically lags spot market conditions. The deceleration to 3.0% reported by the U.S. Department of the Treasury indicates that the pricing softness recorded across private rental markets over preceding quarters has now worked through reporting delays and registered in federal economic accounts.
Private rental fundamentals: Record vacancy and stalled rents
Underlying rental property indicators confirm that landlord pricing power has sharply contracted. Data from MMCG Invest shows that national asking rent growth slowed to 0.1% year-over-year in the first quarter of 2026, the lowest annual rate since the fourth quarter of 2010.
At the same time, multifamily supply pressure has driven availability higher. The national multifamily vacancy rate rose to 8.6% in the first quarter of 2026, its highest level since the post-2008 recovery era, according to MMCG Invest.
Market stabilization is expected to be gradual. MMCG Invest projects national vacancy to average near 8.5% through the remainder of 2026 before compressing toward 7.5% by 2030.
| Metric | Level / Growth Rate | Historical Context / Forecast | Source |
|---|---|---|---|
| Rent of Housing Inflation | 3.0% YoY (March 2026) | Slowest since Sept 2021; below 3.3% pre-pandemic avg. | U.S. Treasury |
| Real GDP Growth | 2.0% annualized (Q1 2026) | Rebounded from 0.5% in Q4 2025 | U.S. Treasury |
| Multifamily Asking Rent Growth | 0.1% YoY (Q1 2026) | Weakest pace since Q4 2010 | MMCG Invest |
| National Multifamily Vacancy | 8.6% (Q1 2026) | Highest level since post-financial-crisis era | MMCG Invest |
| Multifamily Vacancy Outlook | ~8.5% (2026) $\rightarrow$ 7.5% (2030) | Multi-year absorption horizon | MMCG Invest |
The underwriting squeeze: NOI constraints and refinancing gaps
The convergence of flat asking rents of 0.1% and elevated vacancy of 8.6%, as reported by MMCG Invest, creates an operational bottleneck. When gross revenue growth stalls, properties have less cushion to absorb ongoing operating and capital expenditures. While macroeconomic datasets from the U.S. Department of the Treasury do not track property-level operating line items or loan terms, the baseline figures point to constrained revenue headroom across the sector.
This top-line stagnation directly affects debt underwriting. Debt-service coverage ratios depend on net operating income, which narrows when flat rent collections meet rising operating expenses. Because lenders evaluate replacement financing against current property cash flows, lower coverage ratios translate into smaller loan proceeds. Properties that secured high leverage during past cycles will face debt shortfalls when existing loans mature.
With vacancy projected by MMCG Invest to remain near 8.5% through 2026, borrowers cannot depend on swift revenue gains to resolve underwriting shortfalls. Owners must either contribute additional equity to pay down principal balances or accept downward valuation adjustments to match reduced property earnings.
Because these national aggregates combine various property classes and regional submarkets, the severity of refinancing gaps will vary based on individual capital structures, local supply pipelines, and specific loan terms.
Key takeaways for market participants
Both official accounts and private market metrics confirm that shelter price growth has decelerated. For multifamily owners and lenders, near-zero rent growth removes the revenue cushion that previously offset rising operating expenses. With vacancy expected to ease slowly toward 7.5% by 2030, according to MMCG Invest, protecting capital will require direct balance-sheet management and disciplined refinancing plans.
Disclaimer: This analysis is for informational purposes only and does not constitute investment, financial, real estate, or legal advice. Always consult a licensed financial advisor before making investment decisions.