
How the Rising 10-Year Treasury Yield Impacts Capital Costs
Macroeconomic pressures and rising benchmark yields: assessing the impact on capital costs
Benchmark yields rose heading into late 2026 as sustained employment gains and inflation reduced expectations for near-term monetary easing. After economic data exceeded forecasts, the Federal Reserve approved a unanimous interest rate increase and signaled that borrowing costs would stay restrictive. Higher baseline yields lift the risk-free rate, raising capital costs for corporations, compressing equity valuation multiples, and increasing debt refinancing expenses.
Labor strength and persistent inflation
Sovereign yields remained elevated heading into the final quarter of 2026, with the US 10-Year Treasury yield recorded at 5.2370% on Trading Economics and 5.28% on October 7, 2026, according to Trading Economics.
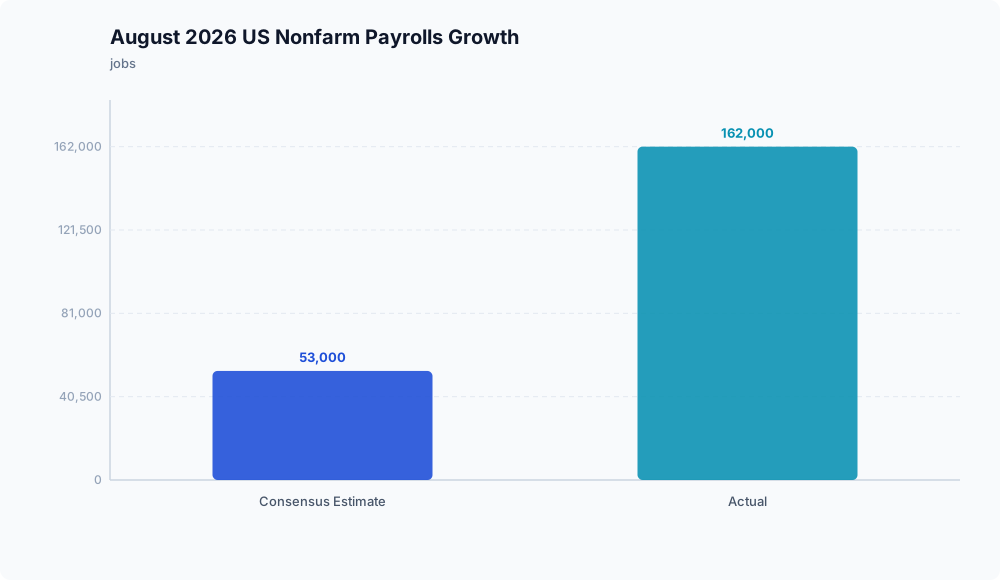
In August 2026, U.S. nonfarm payrolls grew by 162,000, well above the consensus estimate of 53,000, while the unemployment rate held steady at 4.1% and the labor force participation rate rose to 61.6% from 61.4%, according to Crestwood Advisors. Over the same period, headline Consumer Price Index (CPI) readings climbed 0.4% month-over-month and 3.4% year-over-year, as reported by Crestwood Advisors.
August 2026 Economic Indicators vs. Expectations
┌─────────────────────────────────┬──────────┬───────────┐
│ Metric                          │ Actual   │ Consensus │
├─────────────────────────────────┼──────────┼───────────┤
│ Nonfarm Payrolls                │ +162,000 │ +53,000   │
│ Unemployment Rate               │ 4.1%     │ —         │
│ Labor Force Participation Rate  │ 61.6%    │ 61.4%*    │
│ Headline CPI (MoM)              │ +0.4%    │ —         │
│ Headline CPI (YoY)              │ +3.4%    │ —         │
└─────────────────────────────────┴──────────┴───────────┘
*Prior period baseline. Source: Crestwood Advisors.
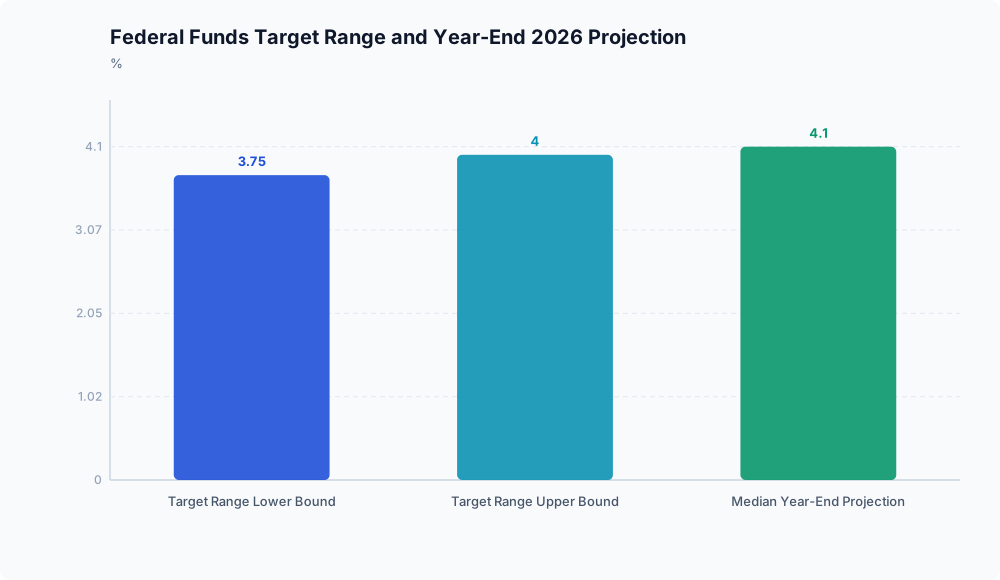
On September 16, 2026, the Federal Open Market Committee voted 12 to 0 to raise the target range for the federal funds rate to 3.75% to 4%, according to Crestwood Advisors. The median year-end 2026 federal funds rate projection was set at 4.1%, indicating policymakers expected an additional rate increase before the end of the year, as detailed by Crestwood Advisors.
Corporate balance sheets: valuations and refinancing
Higher benchmark yields alter corporate finance calculations, primarily through the weighted average cost of capital (WACC).
As the risk-free rate rises, the discount rate applied to future cash flows increases. Under discounted cash flow (DCF) models, this adjustment lowers the present value of long-duration assets, particularly companies whose cash flows are projected further into the future. This compresses price-to-earnings (P/E) multiples and puts downward pressure on equity valuations, even when underlying operating assumptions remain unchanged. The Federal Reserve’s projected 4.1% year-end policy rate indicates that these higher hurdle rates will persist through late 2026, according to Crestwood Advisors.
In corporate credit markets, maturing debt must be refinanced at prevailing benchmark rates plus applicable credit spreads, raising coupon expenses above legacy levels. Higher interest payments reduce debt service coverage and interest coverage ratios, while increased borrowing costs constrain debt-funded share repurchases and marginal capital expenditures.
Because aggregate default rates and specific corporate spread data are not available in current records, the severity of these pressures will vary based on individual corporate capital structures, interest coverage cushions, and debt maturity schedules.
Analytical takeaway


In late 2026, resilient labor indicators and persistent inflation kept central bank policy restrictive. With sovereign yields elevated, corporate valuations depend more heavily on current cash generation and balance-sheet strength than on low discount rates and distant earnings projections.
Disclaimer: This analysis is for informational purposes only and does not constitute investment, financial, real estate, or legal advice. Always consult a licensed financial advisor before making investment decisions.