Multifamily Rent Deceleration and Debt Service Squeeze
Multifamily Rent Deceleration and the Debt Service Squeeze
When top-line rent growth decelerates, properties face a narrower financial cushion above baseline inflation, making it difficult to generate enough net operating income (NOI) to absorb higher debt service burdens. When financing spreads widen significantly over underlying benchmarks, the cost of securing or refinancing debt outpaces the cash flow generated by subdued revenue gains.
Modest rent growth and baseline inflation
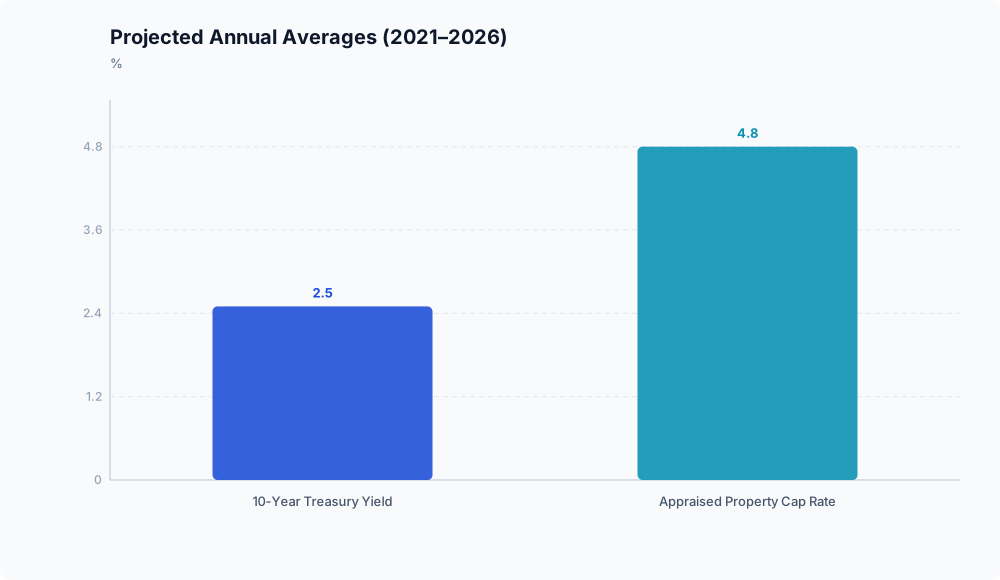
A deceleration in top-line rent growth leaves property operators with a narrow margin for error. Real estate performance relies on organic revenue expansion to outpace operating expenses and fund debt obligations.
By comparison, the Federal Open Market Committee has reaffirmed its longer-run inflation goal of 2 percent, as measured by the annual change in the personal consumption expenditures (PCE) price index (Federal Reserve Board). Because baseline inflation targets sit near 2 percent (Federal Reserve Board), modest rent gains generate only a marginal spread above broader price increases. This leaves little incremental NOI to absorb unhedged property operating costs, such as maintenance, insurance, and payroll.
Expanding debt spreads and refinancing pressure
The pressure created by slowing rent growth intensifies when assets encounter higher borrowing costs. Commercial real estate financing expenses have increased through base rate adjustments and widening credit risk premiums.
In late 2022 and 2023, mortgage-to-Treasury spreads in the United States expanded beyond 300 basis points (REI Prime). When lenders require a risk premium of that size above benchmark Treasuries, the effective interest rate on new originations or refinancings rises sharply.
Under these conditions, debt service requirements expand faster than subdued revenue trends can support. Properties underwritten with low interest rates face immediate cash flow shortfalls when replacing existing debt with loans priced at these wider spreads.
Benchmark yields, cap rates, and valuation headwinds
The debt service squeeze is compounded by shifting property yields relative to risk-free sovereign debt.
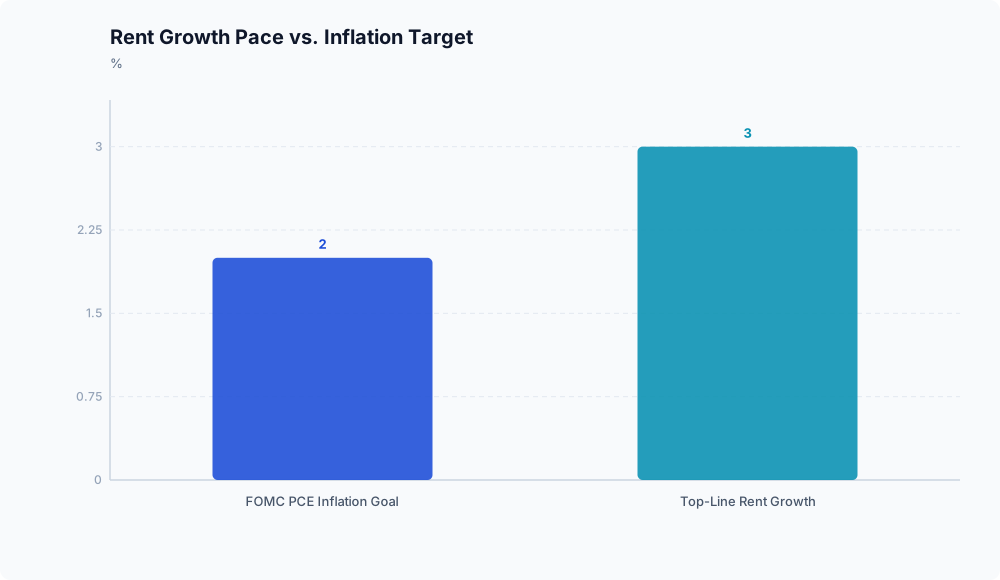
Multi-year forecasting for 2021 to 2026 by CONTI projected that yields on 10-year U.S. Treasury bills would rise to an annual average of around 2.5% (Big Yard Buildings). Over that same multi-year period, current value capitalization rates for appraised commercial properties were projected to average 4.8% annually (Big Yard Buildings).
┌─────────────────────────────────────────────────────────────┐
│ 2021–2026 Multi-Year Projections (CONTI / Big Yard Bldgs)    │
├───────────────────────────────┬─────────────────────────────┤
│ Appraised Property Cap Rates  │ 4.8% annual average         │
│ 10-Year U.S. Treasury Yields  │ ~2.5% annual average        │
├───────────────────────────────┴─────────────────────────────┤
│ Observed Lending Conditions (Late 2022–2023, REI Prime)     │
├───────────────────────────────┬─────────────────────────────┤
│ Mortgage-to-Treasury Spreads  │ >300 basis points           │
└───────────────────────────────┴─────────────────────────────┘
These baseline figures demonstrate a tight spread between sovereign yields and appraised property returns. In practice, as risk-free yields hover near projected averages and mortgage spreads exceed 300 basis points (REI Prime), terminal capitalization rates face upward pressure. Buyers entering the market require wider yield margins to compensate for elevated debt costs.
When exit cap rates rise above historical appraisal marks, such as the projected 4.8% baseline reported by Big Yard Buildings, terminal asset valuations drop, compressing total investor returns.
Empirical boundaries and operational limits

Distinguishing verified macroeconomic indicators from operational assumptions clarifies the scope of current conditions:
- Subdued rent growth provides minimal nominal spread above the Federal Reserve’s 2 percent PCE inflation objective (Federal Reserve Board). Meanwhile, mortgage-to-Treasury spreads expanded past 300 basis points in late 2022 and 2023 (REI Prime), well above historical norms, against a backdrop where 10-year Treasury yields were projected to average around 2.5% alongside 4.8% average cap rates (Big Yard Buildings).
- Available data sets do not track aggregate debt service coverage ratio (DSCR) failure rates, exact loan default totals, or the dollar volume and frequency of required capital calls across syndications.
While financial mechanics indicate that higher interest payments paired with weak revenue growth can trigger DSCR breaches, broad-based distress metrics remain conditional operational risks rather than statistically verified aggregate totals.
Underwriting implications

Commercial real estate operators cannot rely on organic rent growth alone to resolve financing shortfalls. With macroeconomic inflation targeted at 2 percent (Federal Reserve Board), net cash flow growth is often insufficient to absorb mortgage spreads exceeding 300 basis points (REI Prime).
For sponsors and investors, this dynamic requires underwriting to prioritize conservative exit cap rates and sufficient liquidity reserves. Properties facing loan maturities cannot expect revenue growth to outrun elevated replacement debt costs without operational intervention or capital restructuring.
Disclaimer: This analysis is for informational purposes only and does not constitute investment, financial, real estate, or legal advice. Always consult a licensed financial advisor before making investment decisions.