
Wall Street Bank Q3 Earnings: Inside JPMorgan's Results
Wall Street Bank Q3 Earnings: Unpacking JPMorgan Chase’s Lending Strength and Market Impact
What do JPMorgan Chase’s third-quarter 2026 financial results reveal about the bank’s underlying earnings drivers, and do these gains signal broader equity market expansion?
JPMorgan Chase’s third-quarter performance was propelled by double-digit growth in core lending and deposits rather than one-off revenue windfalls. However, these localized banking gains cannot be viewed as a catalyst for broad stock market valuation expansion, nor do the disclosures provide enough detail to prove whether institutional activity favored defensive hedging over productive corporate investment.
Core Lending and Capital Strength Anchor Performance
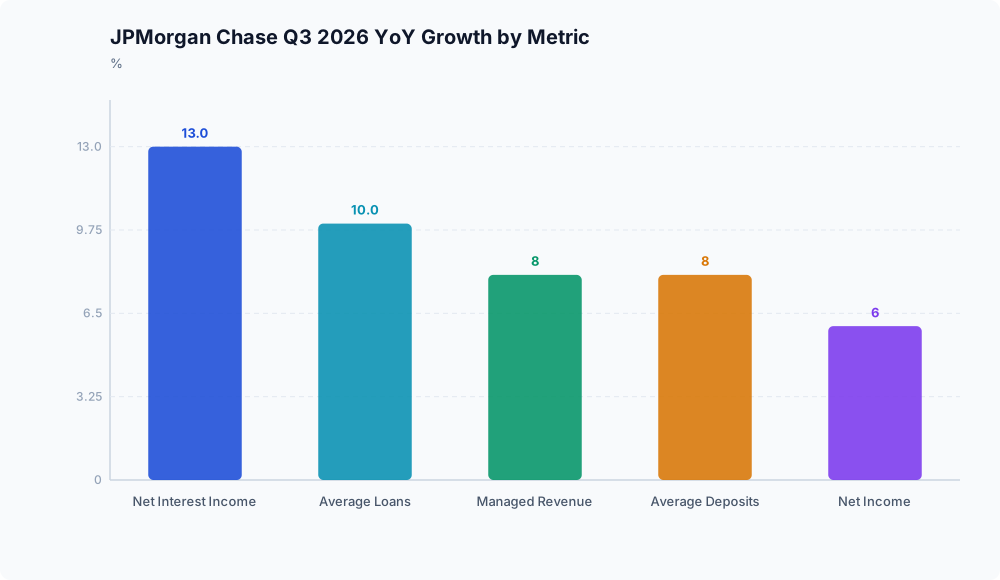
For the third quarter of 2026, JPMorgan Chase reported net income of $15.3 billion, or $5.57 per share—a 6% increase year over year—on managed revenue of $50.9 billion, which rose 8% compared to the prior-year period, according to reporting furnished via Stock Titan. Excluding a significant item, adjusted net income reached $15.8 billion, or $5.75 per share, as reported in the firm’s 3Q26 Earnings Press Release.
The primary engine behind this revenue growth was net interest income, which advanced 13% year over year to $27.1 billion, as documented by JPMorgan Chase & Co.. Balance sheet activity supported this surge: average loans expanded by 10% and average deposits grew by 8% over the prior-year third quarter, while the bank maintained a standardized Common Equity Tier 1 (CET1) capital ratio of 13.9%, according to Stock Titan.
Because net interest income growth (+13%) outpaced overall managed revenue growth (+8%), the data indicates that traditional lending and balance sheet expansion drove profitability. Furthermore, supporting double-digit loan growth while maintaining a 13.9% standardized CET1 ratio demonstrates that the firm expanded its balance sheet without eroding its regulatory capital buffers.
Segment Limitations: Hedging vs. Capital Expansion
While balance-sheet capacity clearly expanded, the furnished filings leave critical questions unanswered regarding client behavior. In particular, it remains unclear whether institutional performance was driven by defensive hedging or proactive capital investment.
The disclosures reported by Stock Titan aggregate top-line revenue and loan metrics without delineating sub-segment performance across markets trading desks, debt underwriting, or advisory fees.
Without granular, division-level reporting separating market-making activity from corporate borrowing and advisory mandates, any conclusion that trading desks outperformed because of defensive hedging remains an unverified inference rather than an established fact.
Why Bank Resiliency Does Not Guarantee Broader Market Multiple Expansion

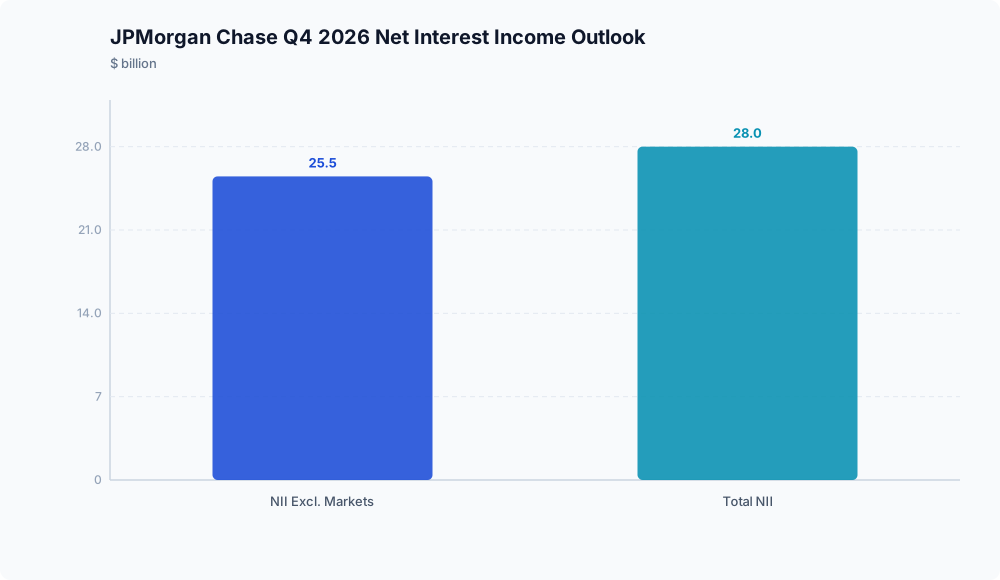
A money-center bank generating $15.3 billion in quarterly net income illustrates strong profitability under prevailing interest rate conditions, as documented by JPMorgan Chase & Co.. Looking forward, management guidance projects fourth-quarter 2026 total net interest income of about $28 billion and net interest income excluding Markets of approximately $25.5 billion, according to Tickeron. Yet, strong banking sector earnings do not automatically translate into higher valuation multiples for broader equity benchmarks such as the S&P 500.
In standard valuation frameworks, high prevailing discount rates elevate the cost of capital across the economy, mechanically suppressing the present value of future corporate cash flows regardless of banking sector performance. Additionally, if maintaining deposit volume requires higher funding costs across the financial sector, margin sustainability may serve as an industry headwind rather than a driver of market-wide price-to-earnings expansion.
The available reporting is strictly limited to single-firm disclosures. It does not contain empirical measurements of benchmark yield levels, system-wide deposit beta trajectories, or aggregate S&P 500 price-to-earnings multiples (JPMorgan Chase & Co.). While elevated risk-free rates logically present valuation friction for broader equities, drawing a direct causal link between JPMorgan’s earnings results and index-level valuation ceilings remains an analytical interpretation that requires broader market data to verify.
Key Analytical Takeaways

The evidence confirms that JPMorgan Chase navigated the third quarter of 2026 from an operational position of strength, utilizing solid deposit and loan growth to expand net interest income alongside durable capital ratios.
For investors and analysts, the central takeaway is twofold:
- Firm-specific durability: Lending and deposit expansion can maintain franchise profitability even without extraordinary non-interest windfalls.
- Macro boundaries: Robust results at a single money-center institution cannot be generalized into broader conclusions about corporate risk appetite or index-wide equity re-ratings without segment-level fee data and macroeconomic yield indicators.
Disclaimer: This analysis is for informational purposes only and does not constitute investment, financial, real estate, or legal advice. Always consult a licensed financial advisor before making investment decisions.