
FOMC Policy Rate and Reserve Management Purchases: Impact
How higher benchmark rates constrain equity valuations despite lower risk premiums
Central bank policy settings and reserve management operations directly influence monetary conditions, but their ultimate impact on equity markets depends on how discount rates translate across valuation frameworks. Even when the equity risk premium (ERP) contracts, a higher floor on the baseline risk-free rate acts as an effective brake on broad equity multiples. When baseline discount rates remain elevated, the mathematical drag on discounted cash flows counterbalances the valuation benefit of a lower risk premium.
The mechanics of capital costs and discount floors
In corporate valuation frameworks, the cost of equity serves as the hurdle rate for discounting projected future cash flows. Shifts in its core inputs—namely the risk-free rate and the ERP—directly dictate broad market valuations Ryan O’Connell.
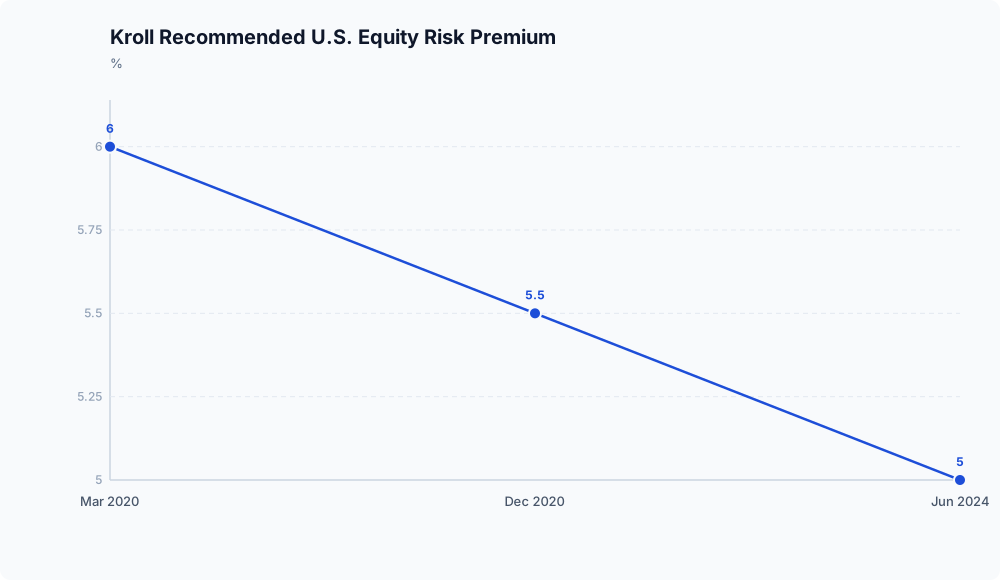
Effective June 5, 2024, valuation advisory firm Kroll lowered its recommended U.S. ERP to 5.0%, down from 5.5% (effective December 9, 2020) and 6.0% (effective March 25, 2020). In an earlier update, Kroll raised its normalized U.S. risk-free rate benchmark from 3.0% to 3.5%, stipulating that spot 20-year U.S. Treasury yields should supersede this baseline whenever they trade higher.
For an average-risk asset ($\beta = 1.0$), this combination establishes a baseline nominal discount rate floor of at least 8.5% Kroll. While a lower ERP nominally reduces the excess return demanded by equity investors over sovereign debt, lifting the risk-free rate floor prevents aggregate hurdle rates from falling back toward earlier ultra-low levels Kroll.
Valuation sensitivity to rate baselines
Small movements in discount rate inputs exert a substantial impact on fair value calculations. Valuation models published by Ryan O’Connell indicate that a 100-basis-point (one percentage point) adjustment in the ERP can alter a company’s implied valuation by 20% to 30%.
Because the Capital Asset Pricing Model treats the risk-free rate and the ERP additively, shifts in baseline sovereign yields exert an identical structural impact Ryan O’Connell. Consequently, when investor risk appetite drives the ERP down to 5.0% Kroll, anchored normalized benchmarks at 3.5% or elevated spot Treasury yields counterbalance that compression. A 20% to 30% contraction in fair value per 100 basis points of discount rate expansion mathematically restricts broad price-to-earnings and enterprise-value multiples across equity indices Ryan O’Connell.
| Valuation Input / Metric | Historical Benchmark / Value | Source |
|---|---|---|
| U.S. Recommended ERP | 5.0% (effective June 5, 2024) | Kroll |
| Prior U.S. Recommended ERP | 5.5% (Dec 9, 2020) / 6.0% (Mar 25, 2020) | Kroll |
| Normalized Risk-Free Rate | 3.5% (or spot 20-yr Treasury if higher) | Kroll |
| Valuation Impact per 100 bps ERP shift | 20% to 30% change in implied value | Ryan O’Connell |
| U.S. Excess Return (Geometric, vs. T-Bonds) | ~4.6% (1926–2024); ~3.5% (2000–2024) | Ryan O’Connell |
| Global Excess Return (Geometric, vs. Bonds) | ~3.0% to 5.0% (23 countries, 1900–present) | Ryan O’Connell |
Historical context and limits to premium compression
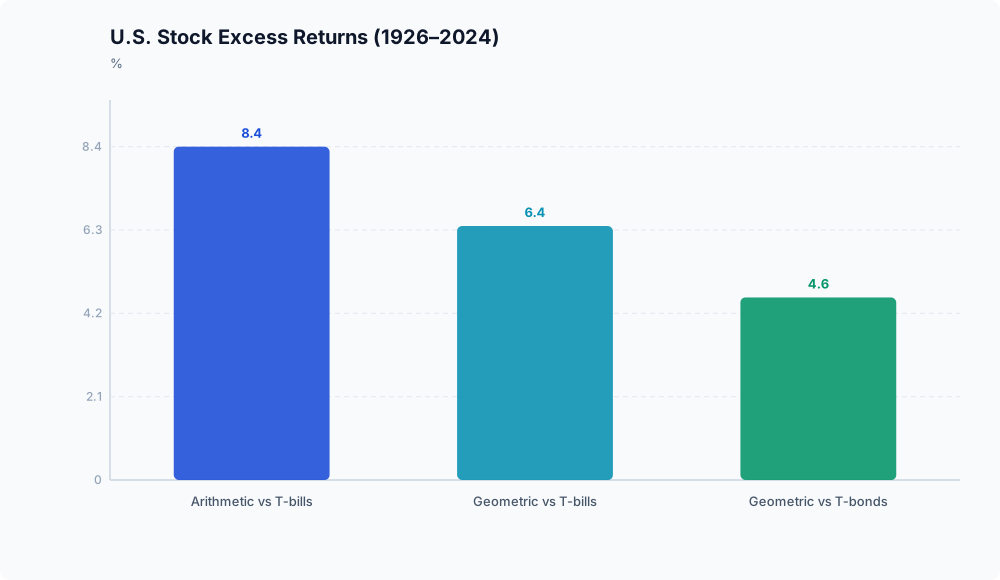
A 5.0% ERP benchmark aligns with long-term historical excess returns, suggesting limited capacity for further natural compression Kroll. According to data compiled by Ryan O’Connell, historical geometric excess returns of U.S. equities over Treasury bonds were:
- ~4.6% from 1926 to 2024 Ryan O’Connell
- ~3.8% from 1960 to 2024 Ryan O’Connell
- ~3.5% from 2000 to 2024 Ryan O’Connell
Over these same windows, geometric excess returns over short-term Treasury bills were approximately 6.4% (1926–2024), 5.2% (1960–2024), and 4.8% (2000–2024), while arithmetic mean excess returns over T-bills measured approximately 8.4%, 7.0%, and 6.5%, respectively Ryan O’Connell.
Globally, the Dimson-Marsh-Staunton dataset spanning 23 nations from 1900 onward shows a geometric equity premium of roughly 3% to 5% over government bonds Ryan O’Connell. In contrast, standard expected utility theory—such as Rajnish Mehra and Edward Prescott’s 1985 equity premium puzzle analysis—suggests a theoretical premium of only 1% to 2% under conventional risk aversion coefficients of 1 to 10, compared to observed historical premiums of 6% to 8% Ryan O’Connell.
Because the current 5.0% recommended ERP already sits within these long-run empirical norms, equity valuations cannot rely on substantial additional premium compression to drive upside Kroll; Ryan O’Connell. Furthermore, because Kroll dictates that spot long-term Treasury yields replace the 3.5% normalized rate when higher, elevated bond yields feed directly into higher aggregate hurdle rates.
Policy rate transmission and capital costs

The transmission of monetary policy adjustments and reserve-related operations into equity valuations operates primarily through underlying bond yields and benchmark rate floors. While central bank policy directly influences short-term interest rates and money markets, equity valuation frameworks depend heavily on intermediate- and long-term risk-free rates matching long investment horizons Ryan O’Connell.
Consequently, reserve management activities and policy rate decisions only relieve valuation pressures if they lower the sovereign yields used in discounting. When long-term Treasury yields or normalized floors remain anchored around 3.5% or higher, the baseline hurdle rate remains rigid Kroll. This elevation preserves the 20% to 30% valuation penalty associated with higher discount rates and prevents multiple expansion across the broader equity market Ryan O’Connell.
Strategic takeaway

For corporate planners and equity analysts, the empirical data points to a regime change in valuation math. Compressed risk premiums cannot drive sustained multiple expansion while underlying risk-free floors are anchored at 3.5% or tracking higher spot Treasury yields Kroll. With aggregate cost-of-equity hurdle rates floored near 8.5% for average-risk assets, asset prices remain governed by fundamental cash-flow generation rather than expanding valuation multiples Kroll; Ryan O’Connell.
Disclaimer: This analysis is for informational purposes only and does not constitute investment, financial, real estate, or legal advice. Always consult a licensed financial advisor before making investment decisions.