
Business Fixed Investment Capex Drives U.S. GDP Growth
How AI infrastructure spending is reshaping U.S. economic growth
Business fixed investment capex concentrated in artificial intelligence has become a primary engine of U.S. economic expansion. AI-related capital spending, encompassing data centers, equipment, and enterprise software, accounted for half of all U.S. GDP growth over the trailing 12 months ending June 30, 2026, according to Neuberger.
However, this capital expenditure surge does not prove that enterprise investment is structurally displacing household consumption or insulating the broader economy. While corporate balance sheets are underwriting aggregate top-line GDP momentum, the evidence does not measure consumer credit volumes or establish that this cycle will replace long-term consumer-led activity.
The macroeconomic shift toward fixed asset accumulation
Aggregate economic output has shifted toward corporate infrastructure. Over the trailing 12 months ending June 30, 2026, AI-related business investment in physical and digital assets accounted for 50% of total U.S. GDP growth, as reported by Neuberger.
Aggregate GDP resilience has increasingly relied on large corporate commitments to enterprise software, hardware, and physical data facilities, with corporate balance sheets underwriting economic momentum through fixed asset accumulation.
Even so, empirical boundaries remain. Because current macroeconomic datasets do not track consumer credit trends alongside these figures, it remains unverified whether this dynamic marks a permanent structural pivot away from consumer-led expansion or a temporary investment boom occurring in tandem with normal consumption patterns.
Accelerating capex and tech sector revisions
Projections show that enterprise commitments to technology infrastructure are poised to expand further. According to research from Goldman Sachs, global capital spending by AI companies may exceed $500 billion in 2026, with consensus analyst forecasts consistently underestimating the trajectory of this buildout.
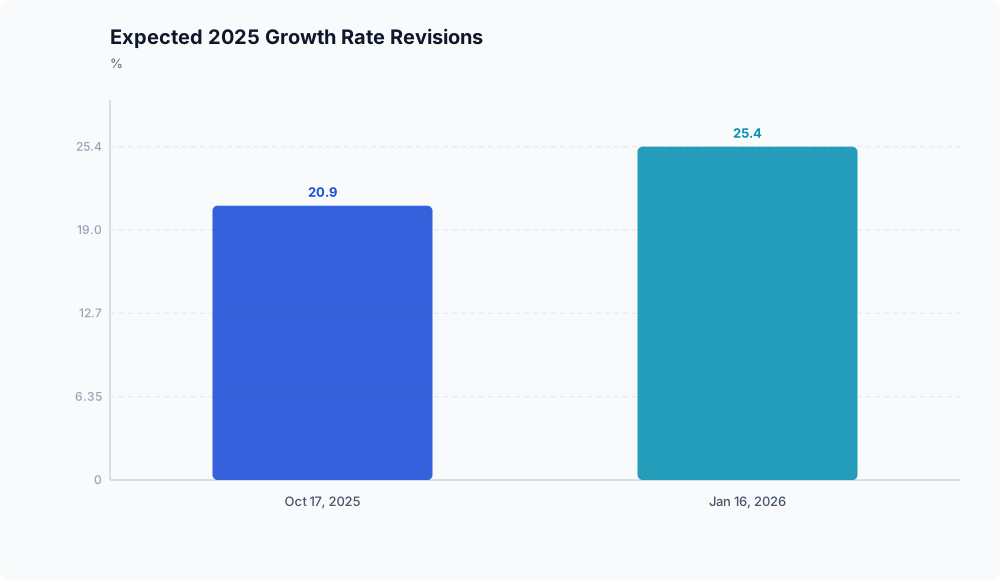
This scale of deployment has directly supported upward revisions in equity earnings projections. LSEG I/B/E/S consensus data tracked by Investing.com shows that the expected full-year 2025 S&P 500 earnings growth rate rose from +20.9% on October 17, 2025, to +25.4% by January 16, 2026. Within the technology sector specifically, consensus earnings growth expectations accelerated from +25.4% for 2025 to +31.1% for full-year 2026.
S&P 500 & Technology Sector Earnings Revisions
┌──────────────────────────────────────┬────────────────┬────────────────┐
│ Metric / Benchmark                   │ Prior Reading  │ Latest Reading │
├──────────────────────────────────────┼────────────────┼────────────────┤
│ S&P 500 2025 Earnings Growth Est.    │ +20.9% (10/25) │ +25.4% (01/26) │
│ Technology Sector 2025 Earnings Est. │ —              │ +25.4% (FY25)  │
│ Technology Sector 2026 Earnings Est. │ —              │ +31.1% (FY26)  │
└──────────────────────────────────────┴────────────────┴────────────────┘
Data Source: LSEG I/B/E/S via Investing.com (as of January 16, 2026)
Market leadership remains concentrated among the primary providers of this infrastructure. As of January 16, 2026, the top three S&P 500 constituents, Nvidia, Apple, and Microsoft, represented 19.77% of the total index market capitalization, according to Investing.com.
While mega-cap technology fundamentals have tracked this high level of spending, the empirical evidence contains no balance-sheet metrics or earnings revision data for the industrial sector. Consequently, asserting that enterprise AI capital expenditure shields industrial earnings from high borrowing costs remains an unverified hypothesis.
Investor differentiation in a higher-rate regime
Although total infrastructure outlays continue to grow, market behavior reflects increasing scrutiny over corporate capital structures. Goldman Sachs notes that investors are rotating away from AI infrastructure firms where operating earnings growth faces pressure and capital expenditures are reliant on debt financing.
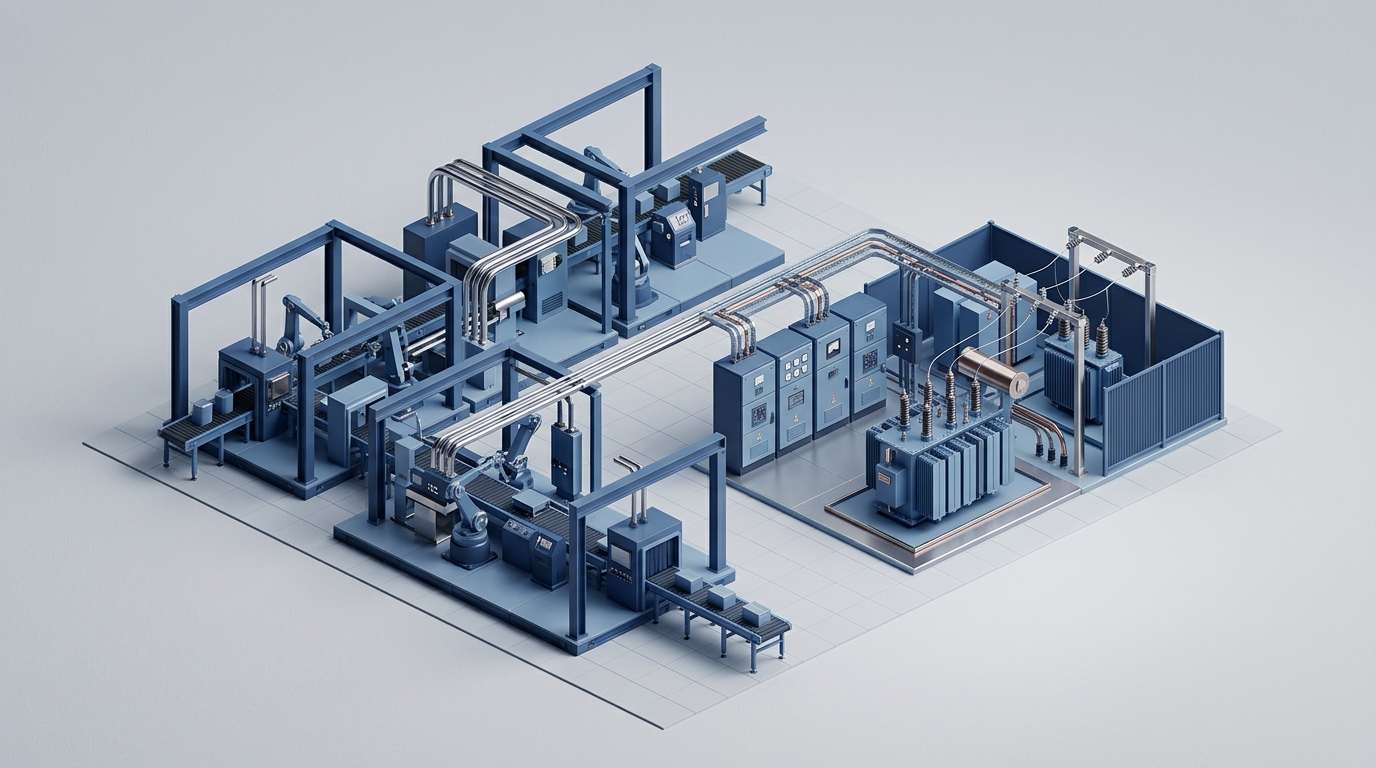
In an environment characterized by elevated discount rates, debt-leveraged expansions and speculative, long-duration returns face heavy penalties. By contrast, entities providing immediate physical supply-chain infrastructure, supported by enterprise purchase orders, have retained an operational advantage over debt-funded participants.
Near-term portfolio leadership depends heavily on cash-funded capital execution. However, available industry data aggregates broader technology infrastructure without isolating specialized automation providers or power utilities. The continuation of this spending cycle remains contingent on durable free cash flow generation among large hyperscalers rather than a broad tailwind across all capital-goods subsectors.
Conclusion: what the evidence means for markets
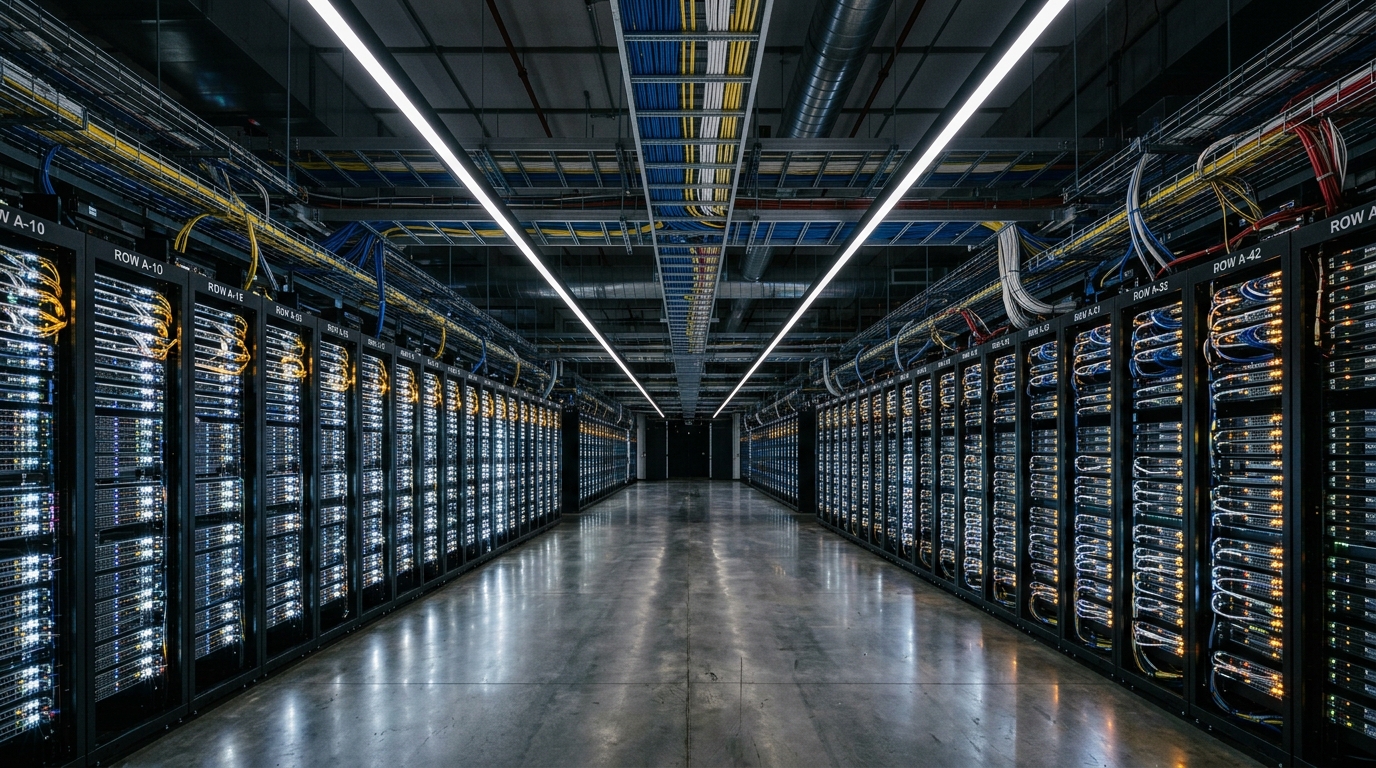
The data confirms that business fixed investment capex in artificial intelligence has supported both U.S. GDP and corporate earnings estimates. Yet this expansion remains concentrated in specific nodes of the digital and physical technology backbone.
Top-line GDP contribution cannot be conflated with diversified market strength. Because the cycle is heavily underpinned by balance-sheet cash flows from a small cohort of mega-cap leaders, exposure to the AI infrastructure expansion is increasingly sensitive to funding mechanisms. Entities dependent on debt financing to sustain capital spending face widening operational scrutiny, whereas suppliers executing against contracted hyperscaler demand remain the verifiable anchors of this investment wave.
Disclaimer: This analysis is for informational purposes only and does not constitute investment, financial, real estate, or legal advice. Always consult a licensed financial advisor before making investment decisions.