
Treasury Yield Curve Bear-Steepening and CRE Refinancing
How Treasury yield curve bear-steepening strains CRE refinancing
A bear-steepening Treasury yield curve complicates commercial real estate refinancing across the 2026 to 2027 maturity wave by opening a structural refinancing gap. A bear steepener occurs when long-term benchmark yields rise faster than short-term yields, steepening the curve even if central bank policy rates ease or hold steady. Because long-term Treasuries establish the pricing floor for commercial property mortgages, elevated 10-year yields raise private borrowing costs directly. Maturing loans underwritten at lower interest rates often fail to meet lender debt service coverage ratio (DSCR) standards upon renewal without additional equity, resulting in loan extensions, debt-service stress, and maturity defaults.
Benchmark divergence: projections vs. realized rates
In macroeconomic theory, bear steepening is frequently attributed to expanding sovereign deficits and heightened Treasury supply, which prompt investors to demand higher term premia to hold long-dated government debt. The available empirical data does not supply federal deficit figures, Treasury auction sizes, or isolated term-premium metrics, so whether government issuance alone drove yields higher cannot be definitively proven.
Market expectations diverged sharply from realized yields during 2026. While the Mortgage Bankers Association (MBA) projected that the 10-year Treasury yield would average 4.2% in 2026, as reported by Matthews Real Estate Investment Services, Federal Reserve benchmark figures cited by Apers show the 10-year Treasury yield rose to 5.28% by October 7, 2026.
This benchmark expansion feeds directly into commercial loan pricing. Analysis from Charles River CFO shows that the average interest rate on new commercial real estate (CRE) loans reached 6.24% in 2026, compared to an average of 4.76% on maturing legacy debt.
The refinancing backlog and accumulating maturity pipeline
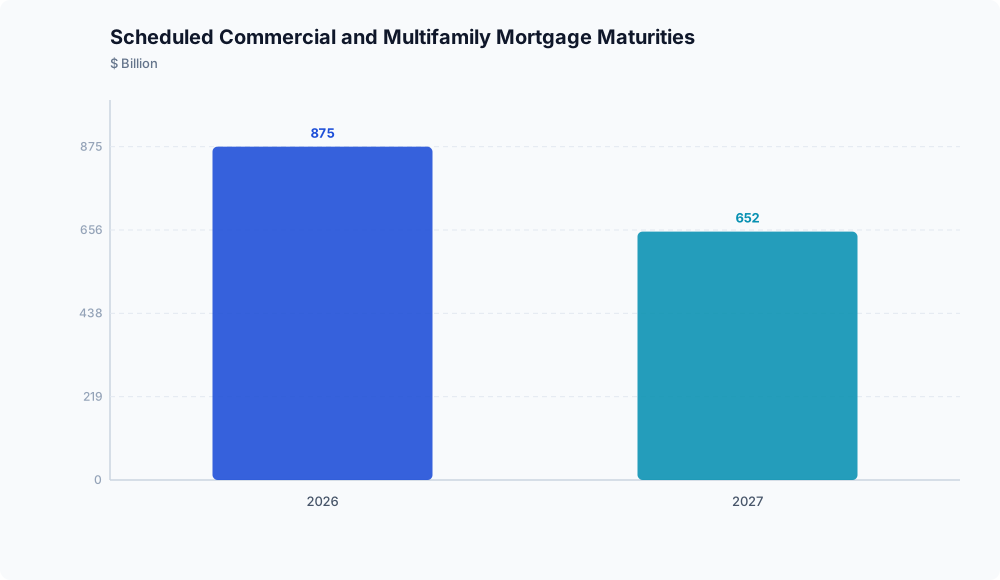
The surge in borrowing costs hits a market that was already struggling to clear expiring credit. Early estimates cited by Matthews Real Estate Investment Services show that only 50% to 55% of the $957 billion in commercial mortgage volume scheduled to mature in 2025 was fully paid off. The remaining 45% to 50% rolled forward into the 2026 and 2027 pipelines.
This rollover backlog compounds an already heavy maturity schedule. According to MBA survey data reported by Matthews Real Estate Investment Services, $875 billion in commercial and multifamily mortgage debt is scheduled to mature in 2026, followed by $652 billion in 2027. Looking across broader tracking parameters, Kidder Mathews monitors $1.26 trillion in commercial real estate debt coming due through 2027, as cited by Apers.
Multifamily assets make up an expanding share of this schedule. Data from MMG Real Estate Advisors cited by Apers shows multifamily maturities rising from $104.1 billion in 2025 to $162.1 billion in 2026, and to $167.7 billion in 2027.
Balance-sheet concentration and structured credit stress

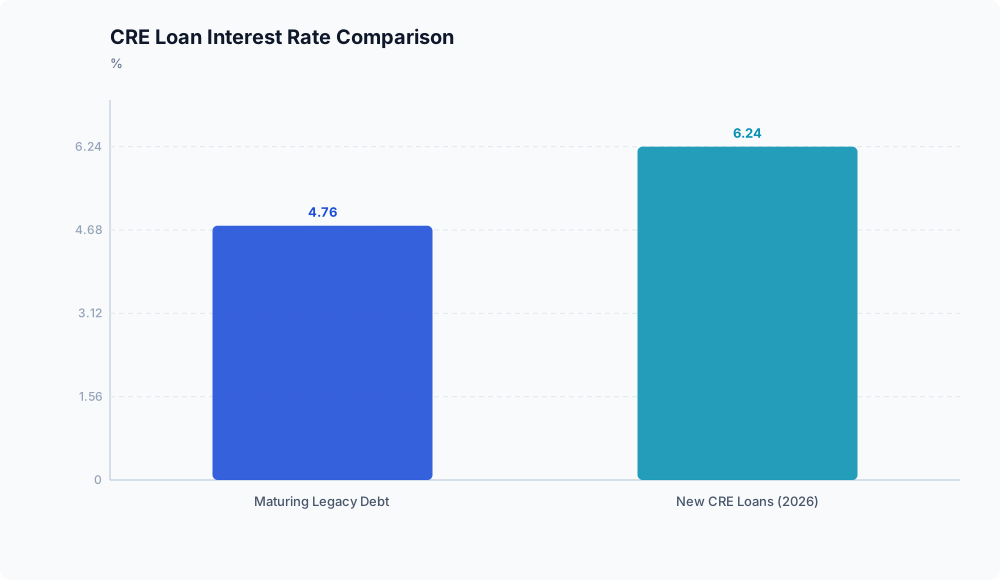
Higher base yields compress debt service coverage. When replacement debt carries a 6.24% rate instead of the legacy 4.76%, annual debt service increases and lowers the property’s DSCR. If net operating income cannot satisfy underwriting thresholds, borrowers cannot refinance the full principal balance without providing fresh equity.
This underwriting friction is concentrated within conventional banking channels. Depository institutions hold $396 billion in commercial mortgages maturing in 2026 alone, accounting for 21% of their overall commercial loan portfolios, according to Matthews Real Estate Investment Services. With more than one-fifth of bank CRE books expiring in a single year, depository balance sheets face elevated liquidity and portfolio-management burdens.
Securitized markets also show signs of distress:
- Morningstar projects that out of more than $100 billion in commercial mortgage-backed securities (CMBS) coming due in 2026, approximately $57.7 billion is likely to default at maturity, as reported by Apers.
- Surveillance data published by Charles River CFO shows overall CMBS delinquencies at 7.29%, with multifamily CMBS delinquencies reaching 6.59%.
The capital lock-in effect
When the long end of the Treasury curve steepens, commercial real estate borrowing costs decouple from short-term policy easing. Even if central bank rates drop, property debt remains linked to long-term benchmark yields that sit above legacy levels.
This dynamic creates capital lock-in, where sponsors maintain existing low-rate debt structures for as long as lenders grant extensions. Once those extensions expire, the difference between expiring 4.76% coupons and replacement financing at or above 6.24% requires action. Unless asset owners inject junior capital or recapitalize their balance sheets, standard refinancing fails, leading to forced sales, workouts, or maturity defaults.
Evidentiary note: The underlying data in this analysis pertains exclusively to commercial real estate and multifamily debt markets. The available evidence does not include figures for single-family residential mortgages, and these findings should not be extrapolated to owner-occupied housing.
Disclaimer: This analysis is for informational purposes only and does not constitute investment, financial, real estate, or legal advice. Always consult a licensed financial advisor before making investment decisions.