
How Treasury Bear Steepening Reshapes Equity Valuations
How a Treasury bear steepening reshapes equity valuations
When long-term Treasury yields surge faster than short-term policy rates, the risk-free hurdle rate rises across the economy and compresses the equity risk premium (ERP). For equity markets, this dynamic mechanically suppresses valuation multiples, particularly for long-duration growth assets reliant on distant earnings, while raising borrowing costs for capital-intensive businesses.
The anatomy of the 2026 yield curve shift
A bear steepening takes place when long-dated interest rates increase more rapidly than short-term benchmark rates, steepening the yield curve while lifting borrowing costs across maturities.
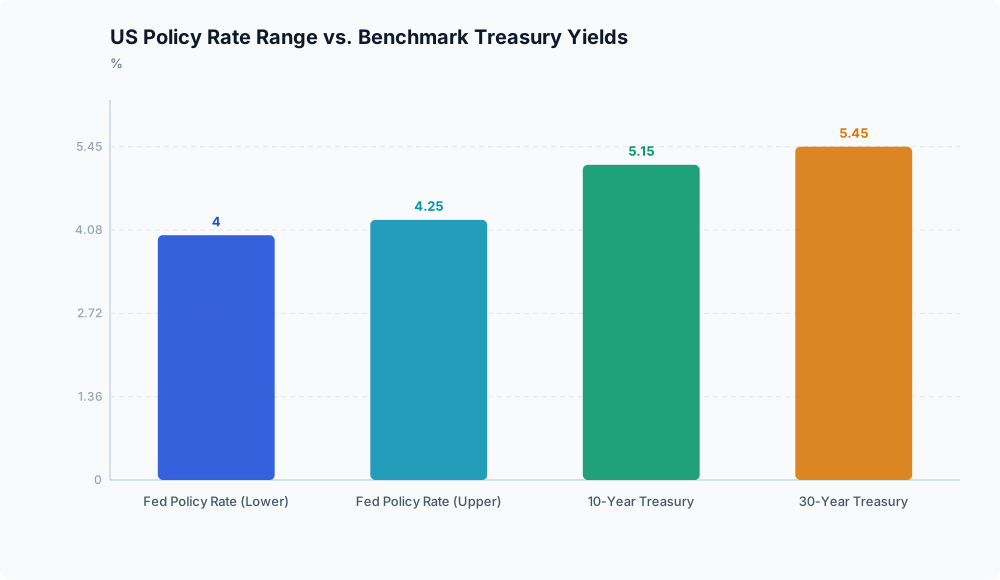
On September 24, 2026, benchmark 10-year US Treasury yields reached 5.15% and 30-year bond yields climbed to 5.446%, establishing a substantial spread above the Federal Reserve’s policy rate band of 4.00% to 4.25%, according to Parallax. This widening spread indicates that investors require a higher term premium to commit capital over multi-decade horizons instead of tracking short-term central bank rates.
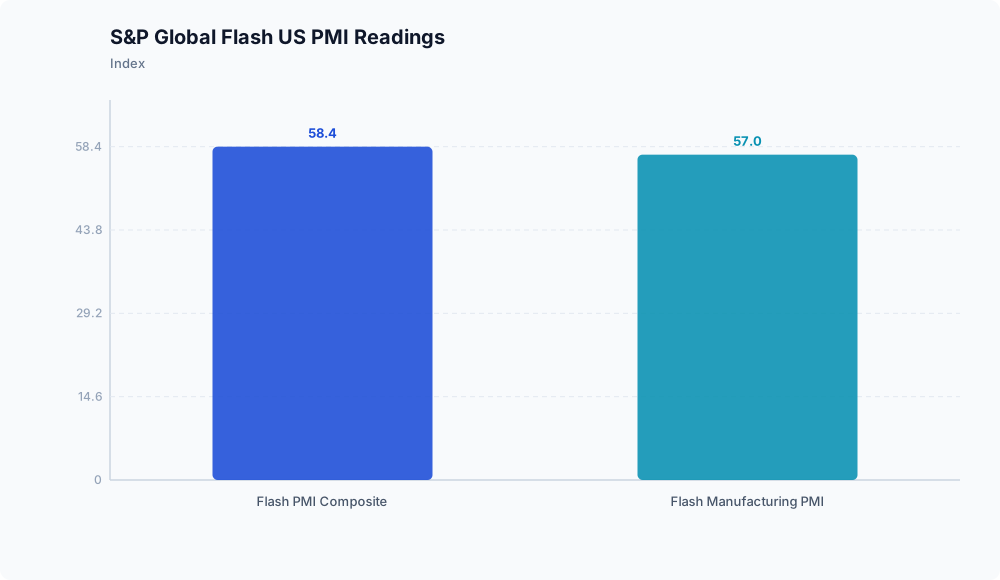
Upward pressure on duration yields reflects both intense competition for private capital and ongoing macroeconomic expansion. In September 2026, the S&P Global Flash US PMI composite registered at 58.4, with the manufacturing gauge rising to 57.0, as reported by Parallax. Simultaneously, hyperscalers and technology infrastructure consortiums issued over $120 billion in investment-grade bonds bearing coupons between 5.5% and 6.2% Parallax.
Large-scale corporate issuance offering attractive nominal coupons directly contends with sovereign debt for balance-sheet capacity, lifting clearing yields across maturities. However, limits in the available data must be noted: while the metrics confirm elevated yields, heavy corporate supply, and expanding business activity, they do not provide specific breakdowns of federal deficit growth or Treasury auction absorption. Consequently, the isolated contribution of federal deficits relative to aggregate private credit demand cannot be determined from the reported figures alone.
Compressing the equity risk premium
Historically, institutional asset allocation has relied on an equity risk premium to compensate investors for bearing equity volatility over government paper. Between 2003 and 2023, the US forward equity risk premium averaged between +320 and +450 basis points, according to Parallax.
That historical compensation buffer is challenged when 10-year Treasury yields cross 5.15% and high-grade corporate debt yields up to 6.2% Parallax. When risk-free benchmarks yield more than 5%, the required return on equity rises correspondingly. Without an upward re-rating in corporate earnings yields or a drop in equity prices, the spread between stocks and risk-free debt narrows, reducing compensation for market risk.
Valuation headwinds and capital rotation
A higher baseline cost of capital affects equity market fundamentals through two primary channels: discount rates and debt financing.
First, standard discounted cash flow models apply higher discount rates to expected future earnings when long-term interest rates climb. For growth-oriented equities whose valuations depend on cash flows projected years into the future, higher discount rates lower the present value of those flows, placing downward pressure on price-to-earnings multiples.
Second, corporate balance sheets face higher marginal debt service costs. When top-tier borrowers must issue debt carrying 5.5% to 6.2% coupons Parallax, the hurdle rate for capital expenditures rises. Debt-funded expansion projects face tighter profit margins, creating financial pressure for enterprises with upcoming debt maturities or extended timelines to generate positive cash flow.
Higher sovereign and corporate benchmark rates shift capital incentives away from distant growth profiles toward cash-generative equities. Sectors producing near-term cash flow yields that clear the higher risk-free baseline offer greater resilience against these cost-of-capital headwinds.
Market implications

Equity valuations cannot operate in isolation from long-term sovereign debt. When 10-year and 30-year yields hold above 5% alongside heavy primary corporate issuance, the standard +320 to +450 basis point equity buffer narrows unless earnings yields increase, according to Parallax. Investors must re-evaluate long-duration equity multiples and account for a baseline cost of capital that alters corporate project returns.
Disclaimer: This analysis is for informational purposes only and does not constitute investment, financial, real estate, or legal advice. Always consult a licensed financial advisor before making investment decisions.
Frequently asked questions

Why does a bear steepening penalize high-duration equities more severely than a bull steepening?
In a bull steepening, short-term interest rates fall sharply while long-term rates decline more slowly or remain flat, generally easing overall financial conditions and reducing near-term funding costs. In a bear steepening, long-term yields rise faster than short-term rates, driving up the baseline discount rates applied to distant future cash flows while raising overall debt capital costs across maturities. This directly compresses the present value of high-duration growth companies.